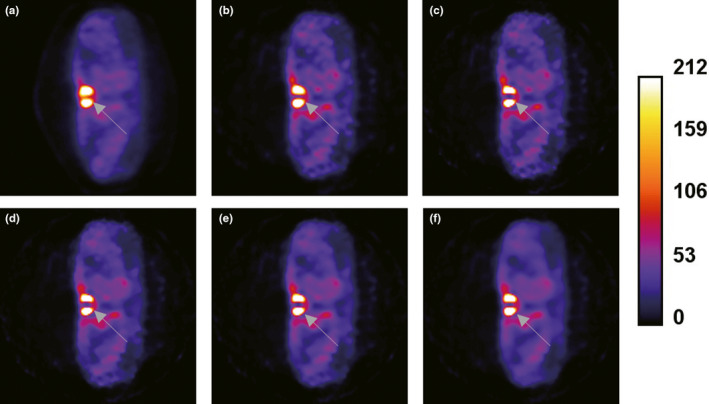
Figure 10.

Transaxial views of reconstructed images obtained for clinical Tc‐99 m Sestamibi SPECT parathyroid, late‐phase study: the clinical Hermes HOSEM method (a); the GPF‐EM method (b); the TV (c, d); and ICTV‐PAPA (e, f) methods, each with two sets of penalty parameters. [Color figure can be viewed at wileyonlinelibrary.com]
