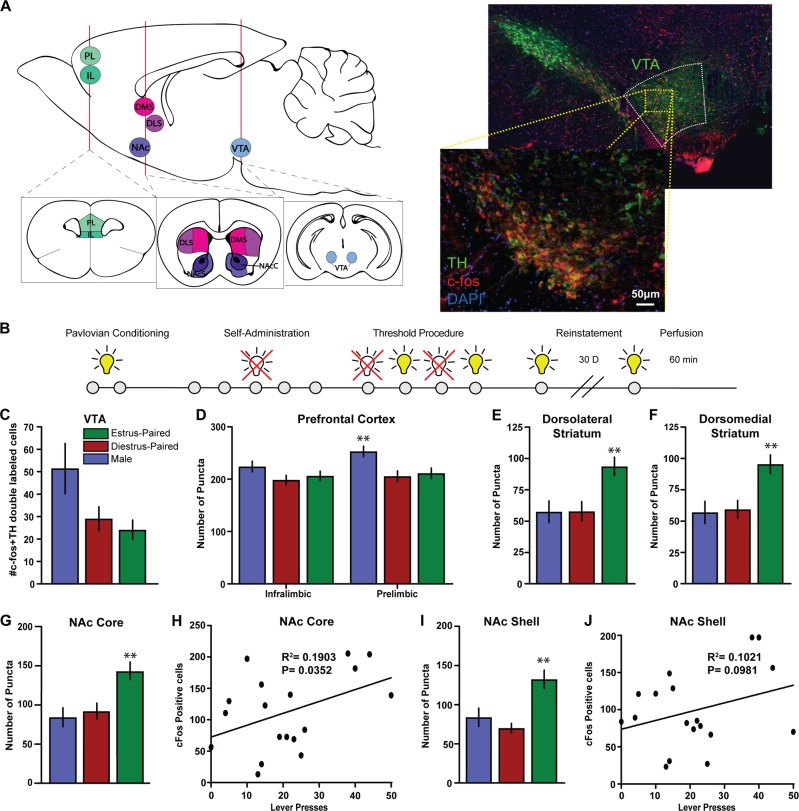
Fig. 4.
Mesolimbic and mesocortical activation patterns that underlie enhanced cue effects on motivation. a Brain diagram depicting specific regions of interest. Assessment of activity, as measured by c-fos expression, was done in the prefrontal cortex (prelimbic and infralimbic regions), the dorsal striatum (dorsolateral and dorsomedial subregions), ventral striatum (nucleus accumbens core and shell) and the ventral tegmental area. (right) Representative image showing staining for TH+ and c-fos+ cells. b Timeline of experiments. c Number of c-fos+ and TH+ double-labeled cells in the VTA across groups. d c-fos+ and NeuN+ double-labeled cells in the infralimbic and prelimbic regions of the prefrontal cortex, *p < 0.05 compared to diestrus group (e) dorsolateral striatum, *p < 0.05 compared to male group (f) dorsomedial striatum, (g) NAc core, *p < 0.05 compared to male group and (i) NAc shell, *p < 0.05 compared to diestrus-paired group. h Correlation between number of lever presses and number of double-labeled c-fos+ and NeuN+ cells in the NAc core or (j) NAc shell. All data are presented as mean ± S.E.M

