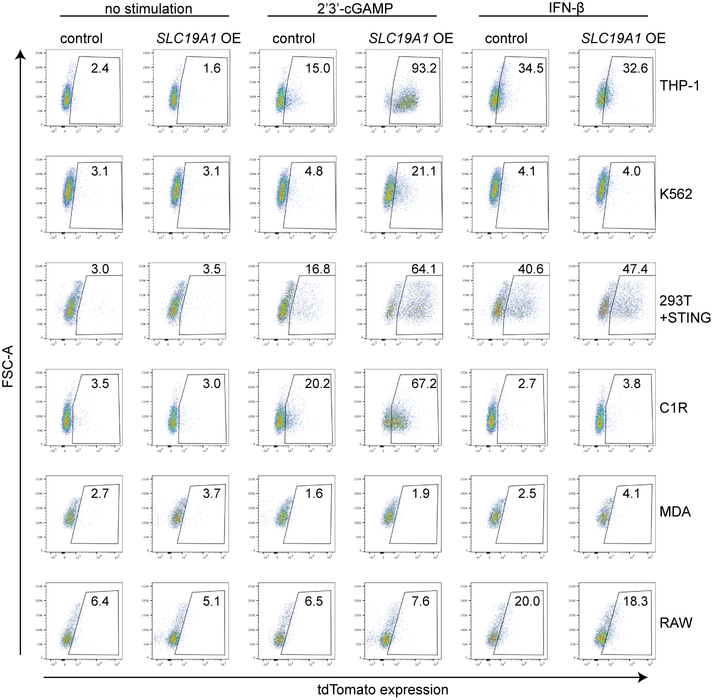
Extended Data Figure 4. SLC19A1 overexpression increases the response to CDNs in various cell lines.
Various cell lines expressing a control vector or an SLC19A1 expression vector (SLC19A1 OE) stimulated with 2’3’-cGAMP (10 μg/ml) (e) or hIFN-β (100 ng/ml) (or 100 ng/ml murine IFN-β in the case of RAW cells). After 20h, reporter expression was quantified by flow cytometry. Representative flow plots of n=3 biological replicates shown in Fig. 2f and Extended Data Fig. 3j.

