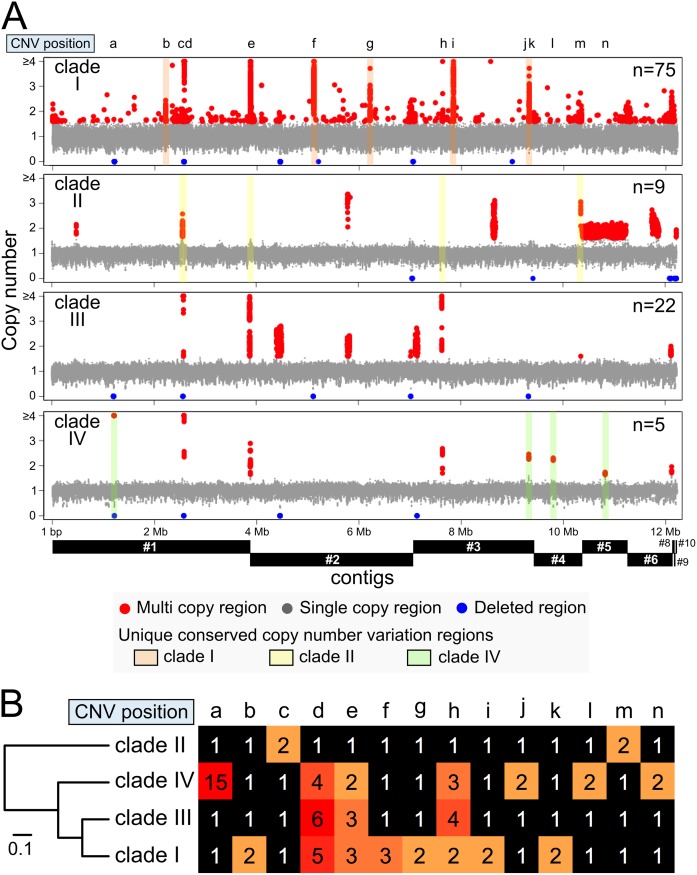
Fig 3. Comparison of copy number variations (CNVs) among four C. auris clades.
(A) A graphic representing the CNV data excluding 22 high variance samples is merged in each clade. A high copy region was defined as having more than 1.6 copies. The conserved CNV regions in each clade are labeled with colored boxes as follows: orange: clade I, yellow: clade II, green: clade IV. Alphabets of small letter indicate the positions of conserved CNVs. CNVs greater than four copies are shown as four copies for ease of interpretation. (B) Phylogenetic tree analysis with conserved CNVs among four clades. The positions of CNV are displayed by alphabets as described above. The copy numbers are showed by a color gradient with black, orange and red. The detailed information of conserved CNVs are described in Table 3.

