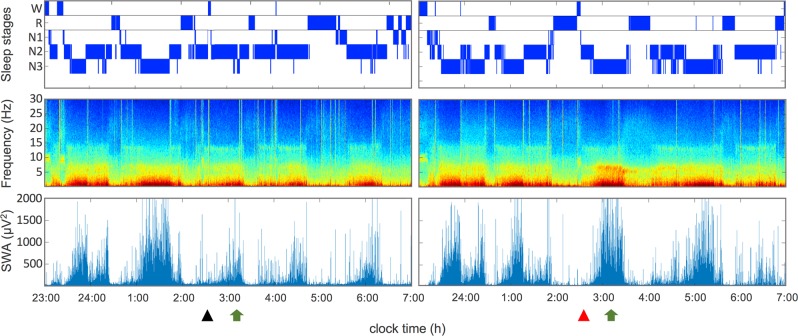
Fig. 1.
Hypnogram (top row), time frequency analysis (middle row), and course of slow-wave activity (bottom row; SWA, power density within 0.75–4.5 Hz; C3A2 derivation) of a single subject (N = 1) after intake of a placebo (left panel) and GHB (right panel). The triangles indicate the time point of placebo (black) GHB (red) administration. Arrows indicate time point of EEG segment extraction for eLORETA analysis (CSD and LPS). N1 stage 1 sleep; N2 stage 2 sleep, N3 stage 3 sleep; R, REMS; W, wake

