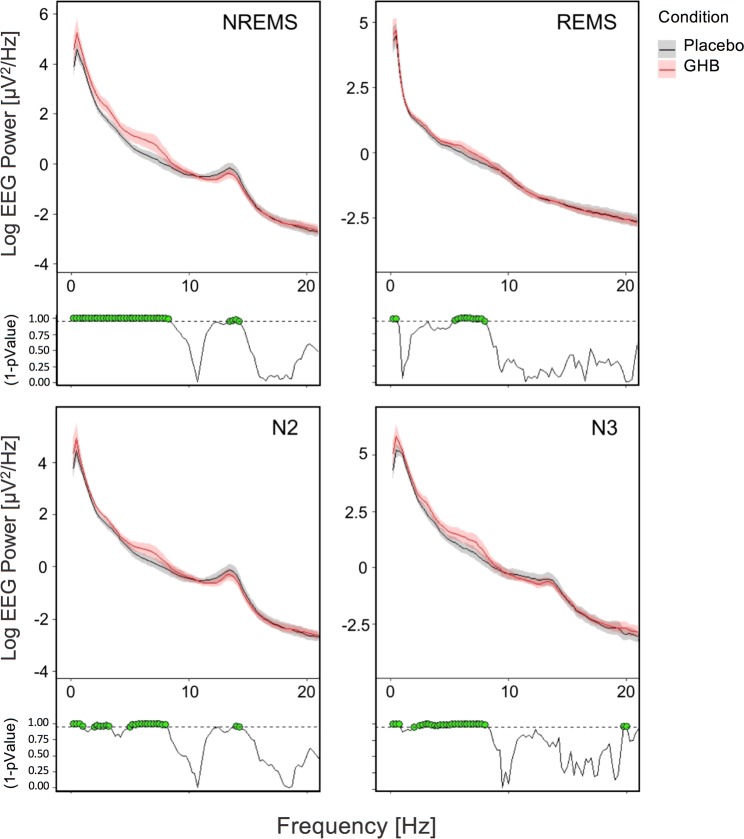
Fig. 3.
Absolute EEG power spectra (C3-A2 derivation) in the second half of the night (02:30–07:00) following GHB (red lines) and placebo (black lines) administration. Mean values and confidence intervals (shading) were plotted for NREM sleep (combined stages N2 and N3), REM sleep, and stages N2 and N3 separately. Green dots at the bottom of the panels indicate frequency bins (0.25 Hz resolution), which differed significantly from placebo (p < 0.05, linear mixed-effects model with condition as within-subject factor)

