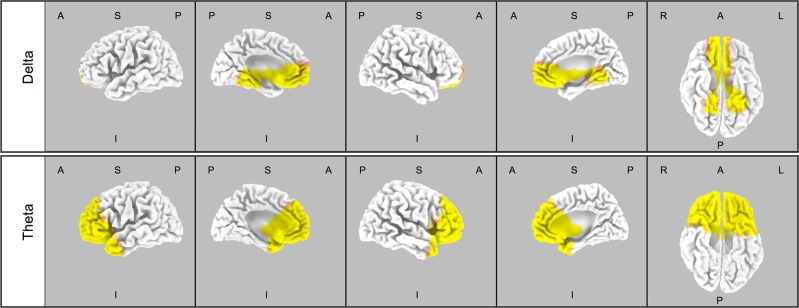
Fig. 4.
Statistical maps depicting the brain regions which differ between GHB and placebo in delta (0.5–4.5 Hz; upper panel) and theta (4.5–8 Hz Hz; lower panel) frequencies in the first NREM sleep episode following GHB and placebo administration (n = 18). Significant log F ratios at p < 0.05 are illustrated in yellow (GHB > placebo) and log F ratios at p < 0.1 are depicted in red (GHB > placebo). Rows from top to down: delta (0.5–4.5 Hz) and theta (4.5–8 Hz). A, anterior; I, inferior; L, left; P, posterior; R, right; S, superior

