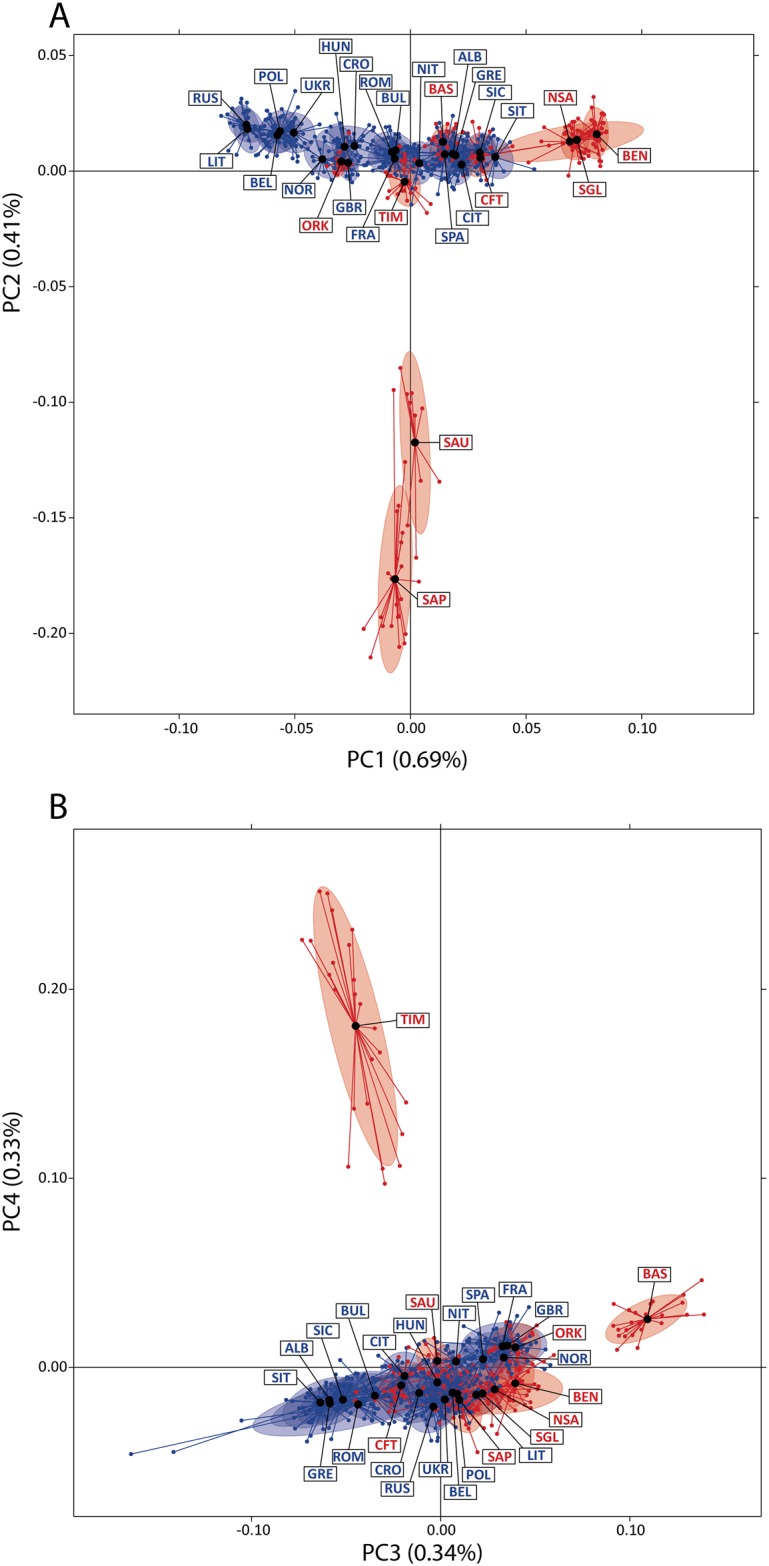
Fig 1. Principal components analysis of the isolated and open populations.

(A) Plot of the first and second components and (B) Plot of the third and fourth components. Black dots represent the centroid for each population. Labels as in Table 1.

(A) Plot of the first and second components and (B) Plot of the third and fourth components. Black dots represent the centroid for each population. Labels as in Table 1.