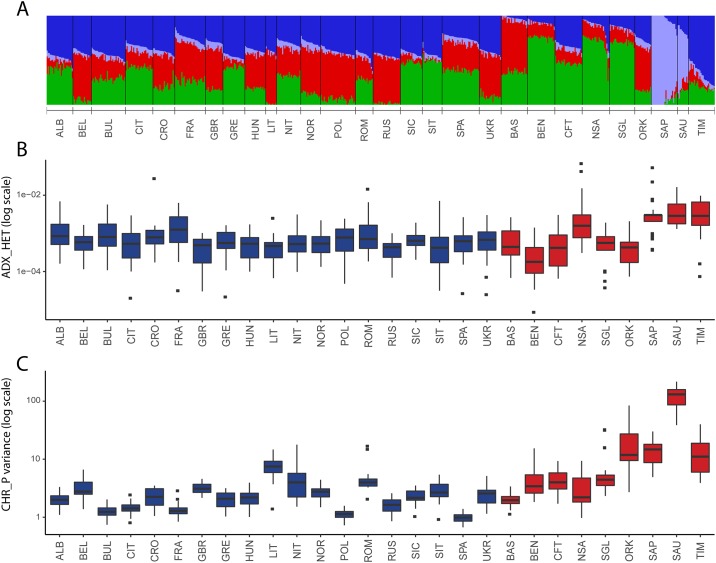
Fig 3. Inter-individual heterogeneity of ancestry components and intra-population haplotype sharing.
(A) Maximum likelihood estimates of individual ancestries (K = 4) for the 28 populations under study; (B) intra-population distribution of the admixture heterogeneity measure (y axis log scale); (C) Inter-individual heterogeneities of the total length of chunks among individuals in each population (y axis log scale; see Materials and methods for more detail).

