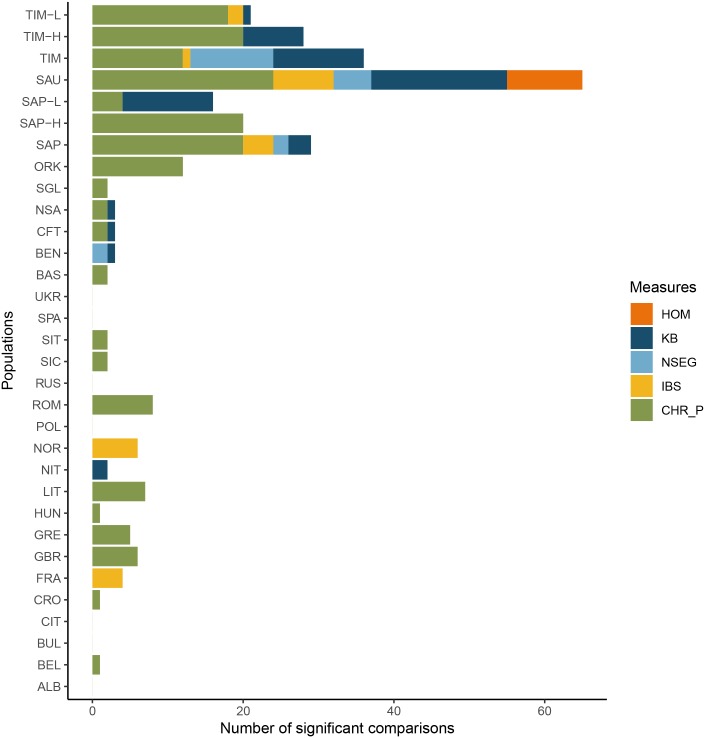
Fig 4. Pairwise comparisons of inter-individual heterogeneity.
Number of statistically significant pairwise comparisons with a ratio between standard deviations >1 after Bonferroni correction. For the measures based on pairwise comparisons (IBS and CHR_P), population variance was calculated using the individual median values. Comparisons between Sappada and Timau and their sub-groups (SAP_VSA, SAP_HTA, TIM_VSA and TIM_HTA) were not included.

