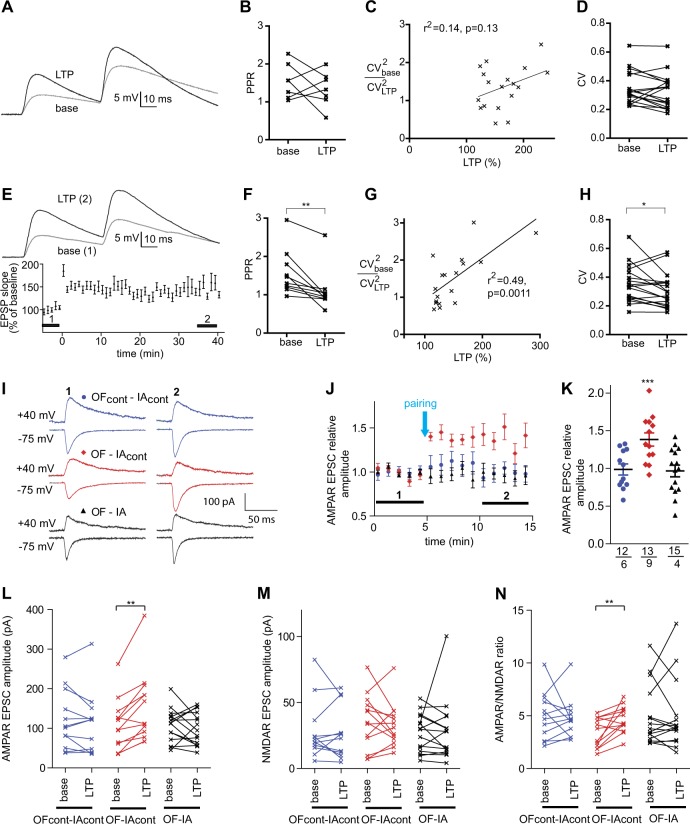
Fig. 2.
OF enables postsynaptically expressed plasticity. a–d Indices of presynaptic plasticity in LTP experiments using the weak STDP protocol in OF-IAcont group. a Examples of paired-pulse recording before (gray, average of the min −5 to −1 of baseline) and after LTP induction (black, average of the min 35–40 after induction). b Summary data for paired-pulse ratios. Lines connect data points representing the same neuron. c Relative CV−2 as a function of LTP (n = 18). d CV at baseline and during the minutes 35–40 after LTP induction. e–h The same comparisons using the strong STDP protocol in OF-naive group. e Upper: An example of paired-pulse recording before (1: gray) and after (2: black) LTP induction. Lower: LTP data (n = 18). f Summary data for paired-pulse ratios (n = 10). g Relative CV−2 as a function of LTP (n = 18). h CV at baseline and during the minutes 35–40 after LTP induction. i–n OF-enabled plasticity induced by the pairing protocol involves increases in the AMPAR current, but not NMDAR current. (i) Examples of AMPAR (lower) and AMPAR/NMDAR mixed currents (upper) before (1) and after (2) the pairing in neurons from OFcont-IAcont (blue), OF-IAcont (red), and OF-IA (black) groups. Averages of 5 consecutive sweeps are shown. j LTP data for the AMPAR EPSC amplitudes before and after the pairing. Each point represents data for 1 min. k AMPAR EPSC amplitudes during the last 5 sweeps of recording, normalized to the mean baseline amplitudes. Values for each cell, among cells averages, and SEM are shown. The numbers of cells and animals are shown under each plot. l–n Mean amplitudes of AMPAR EPSCs (l), NMDAR EPSC (m), and their ratios (n) at the baseline (base) and the minutes 9–10 after LTP induction (LTP). *p < 0.05, **p < 0.01; the Wilcoxon matched pairs test in (b, d, f, h, l, m, n); and the one sample t-test in k

