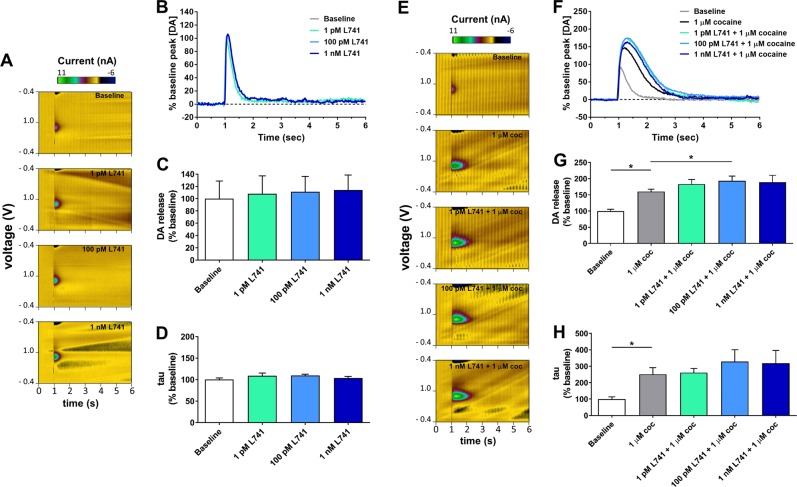
Fig. 2.
Effects of selective D2R antagonism alone or in combination with cocaine on stimulated DA release and DA clearance in the NAc as measured by ex vivo fast scan cyclic voltammetry. Representative a color plots and b current traces depict electrochemical detection of DA in the presence of varied concentrations of the selective D2R antagonist L-741,626. Quantification of c peak stimulated DA release and d DA clearance as a function of applied concentrations of L-741,626 (n = 4). Representative e color plots and f current traces depict electrochemical detection of DA in the presence of 1 µM cocaine alone and in combination with varied concentrations of L-741,626. Quantification of g peak stimulated DA release and h DA clearance in the presence of cocaine alone and in combination with L-741,626 (n = 5). Color plots in (a) and (e) depict representative changes in current in z axis (color) with time along the abscissa and applied cyclic potential along the ordinate. Current traces in (b) and (f) depict release and clearance of DA with time along the abscissa and DA concentration (normalized as a percentage of the mean of all samples collected at the baseline condition) along the ordinate. In (c) and (g), values are depicted as the mean ± SEM maximum DA concentration following stimulation (normalized as percentage of the mean peak DA release at baseline). In (d) and (h), values are depicted as the mean ± SEM calculated tau constant (normalized as percentage of the mean tau value at baseline) *p < 0.05, Dunnett’s test as compared to 1 µM cocaine

