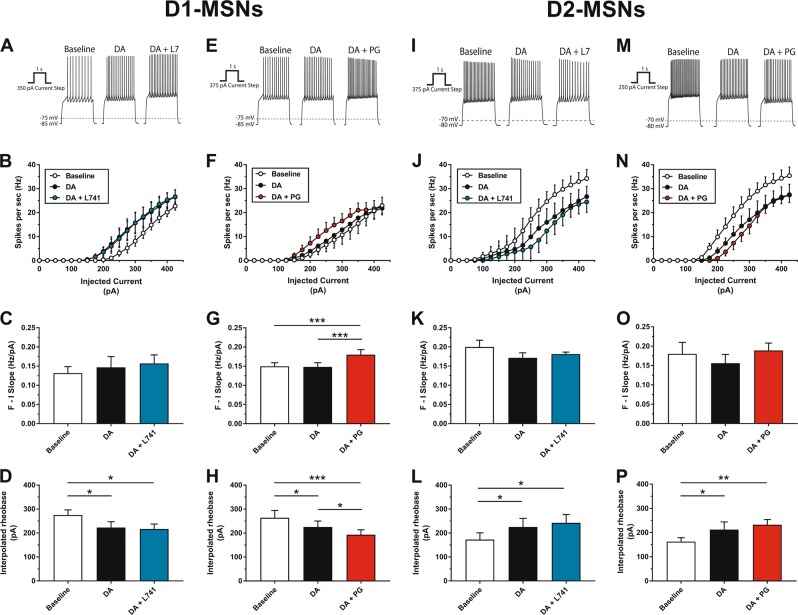
Fig. 4.
Effects of selective D2R or D3R antagonism on neuronal activity in D1-MSNs and D2-MSNs as measured by ex vivo slice electrophysiology. a Representative traces depict the change in firing rate of an individual D1-MSN after application of 60 µM DA followed by 60 µM DA + 1 nM L-741,626. b Firing rate as a function of injected current in D1-MSNs (n = 6) following application of 60 µM DA alone or in combination with 1 nM L-741,626. c F–I slope, quantified through the primary linear range of the F–I curve for each individual D1-MSN (n = 6), following perfusion of 60 µM DA alone or in combination with 1 nM L-741,626. d Interpolated rheobase in D1-MSNs (n = 6) following application of 60 µM DA alone or in combination with 1 nM L-741,626. e Representative traces depict the change in firing rate of an individual D1-MSN after application of 60 µM DA followed by 60 µM DA + 1 nM PG01037. f Firing rate as a function of injected current in D1-MSNs (n = 9) following application of 60 µM DA alone or in combination with 1 nM PG01037. g F–I slope, quantified through the primary linear range of the F–I curve for each individual D1-MSN (n = 9), following perfusion of 60 µM DA alone or in combination with 1 nM PG01037. h Interpolated rheobase in D1-MSNs (n = 9) following application of 60 µM DA alone or in combination with 1 nM PG01037. i Representative traces depict the change in firing rate of an individual D2-MSN after application of 60 µM DA followed by 60 µM DA + 1 nM L-741,626. j Firing rate as a function of injected current in D2-MSNs (n = 5) following application of 60 µM DA alone or in combination with 1 nM L-741,626. k F–I slope, quantified through the primary linear range of the F–I curve for each individual D2-MSN (n = 5), following perfusion of 60 µM DA alone or in combination with 1 nM L-741,626. l Interpolated rheobase in D2-MSNs (n = 5) following application of 60 µM DA alone or in combination with 1 nM L-741,626. m Representative traces depict the change in firing rate of an individual D2-MSN after application of 60 µM DA followed by 60 µM DA + 1 nM PG01037. n Firing rate as a function of injected current in D2-MSNs (n = 5) following application of 60 µM DA alone or in combination with 1 nM PG01037. o F–I slope, quantified through the primary linear range of the F–I curve for each individual D2-MSN (n = 5), following perfusion of 60 µM DA alone or in combination with 1 nM PG01037. p Interpolated rheobase in D2-MSNs (n = 5) following application of 60 µM DA alone or in combination with 1 nM PG01037. Data points are depicted as the mean ± SEM. *p < 0.05, **p < 0.01, ***p < 0.001, significant difference by Holm–Sidak’s test

