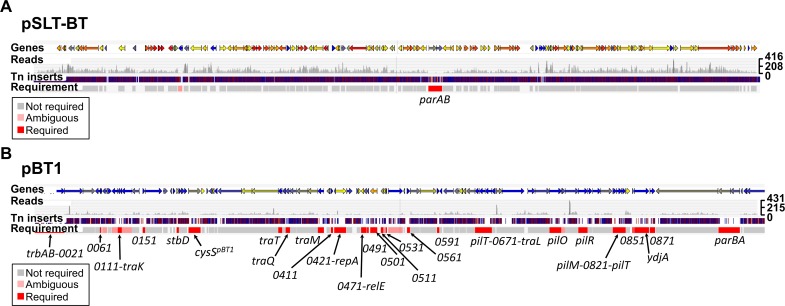
Fig 6. Identification of required genes encoded on S. Typhimurium D23580 pSLT-BT and pBT1 plasmids.
(A) pSLT-BT plasmid; and (B) pBT1 plasmid. Figures were obtained using the Dalliance genome viewer (https://hactar.shef.ac.uk/D23580). Coloured arrows at the top represent genes (colour is based on GC content, blue = low, yellow = intermediate, red = high). Each sample is represented by three tracks, in this case the Input is the only sample shown. The first track shows raw data for the Illumina sequencing reads. The second track contains blue and red lines that correspond to transposon insertion sites; red = + orientation of the transposon, same as genes encoded on the plus strand, blue = opposite orientation. The third track highlights in red those genes that were considered required for growth in that condition based on an insertion index (Materials and Methods). The names of required genes are indicated at the bottom. The scale on the right represents sequence read coverage.

