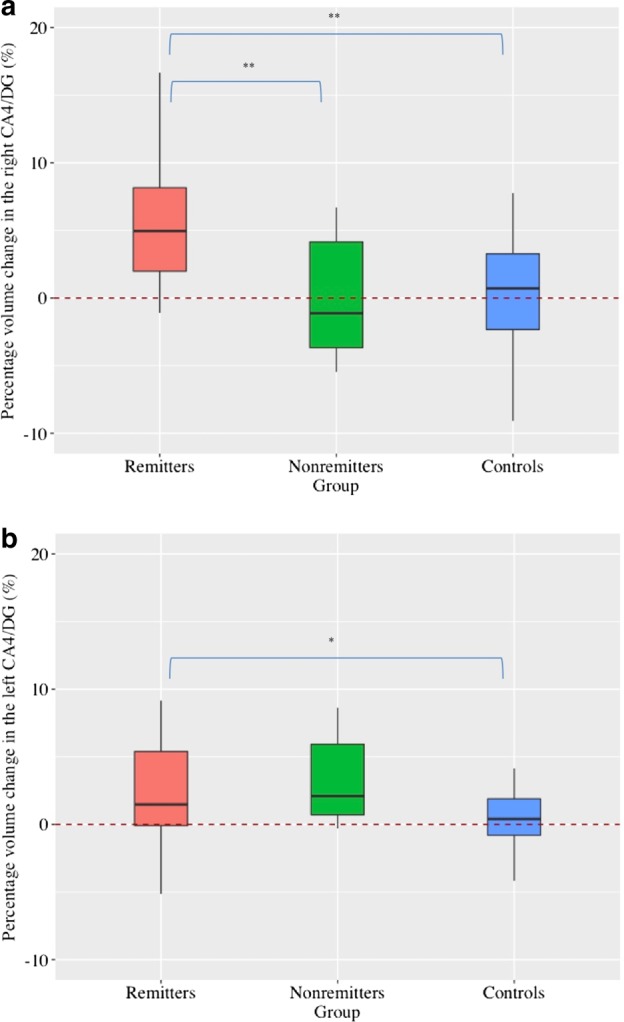
Fig. 2.

Longitudinal effect of ECT on the CA4/DG volume. a There were significant group differences in the right CA4/DG volume changes (F2, 40 = 11.0, p < 0.001). Remitters showed significant larger volume increase than both nonremitters (F1, 21 = 10.28, p = 0.004) and controls (F1, 34 = 21.30, p < 0.001). b There were no significant group differences in the left CA4/DG volume changes (F2, 40 = 3.15, p = 0.05), and post-hoc analyses revealed that remitters showed larger volume increase than controls (F1, 34 = 5.38, p = 0.027). *p < 0.05, **Corrected p < 0.05
