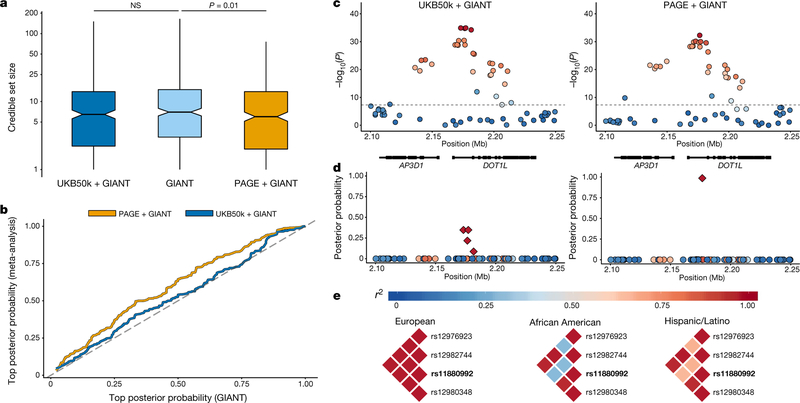
Fig. 3 |. Fine-mapping with multi-ethnic PAGE versus homogeneous UK Biobank samples for height.
a, Comparison of 95% credible sets for height, comparing GIANT alone (n = 253,288) to UKB50k + GIANT (n = 303,288; paired-sample t-test P = 0.37) and PAGE + GIANT (n = 303,069; paired-sample t-test P = 0.01). Box plots show the median as the line in the notch, with the top and bottom of the box indicating the interquartile range. Whiskers extend to either the minimum value or 1.5 × the interquartile range. Notches indicate the 95% confidence interval of the medians. b, Top posterior probability from each 95% credible set for height, comparing GIANT (n = 253,288) to UKB50k + GIANT (n = 303,288) and PAGE + GIANT (n = 303,069). c, Example of results for a height locus from GWAS (rs11880992) in UKB50k + GIANT (n = 303,288) and PAGE + GIANT (n = 303,069), with linkage disequilibrium from weighted matrix from meta-analysis. d, Posterior probabilities for this signal with credible set in indicated by the diamond shapes. e, Linkage disequilibrium (r2) for the original 95% credible set from GIANT results stratified by populations. The index association SNP (rs11880992) with the highest posterior probability is denoted in bold.

