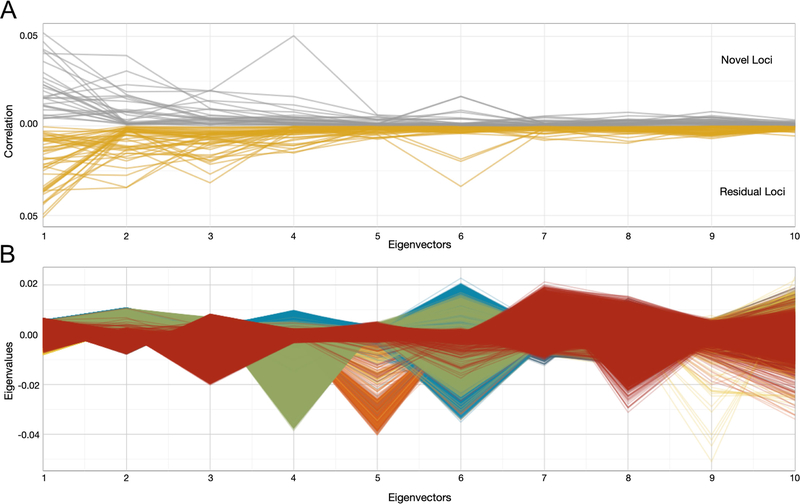
Extended Data Fig. 2 |. Correlation between SNP genotype and PC1-PC10.
a, The correlation (r2) for novel and residual loci calculated by obtaining the individual level data for all PAGE participants and correlating the SNP genotype with each of the ten PCs. The correlation between each locus and each of the ten PCs was plotted on the y axis, novel loci are plotted in grey and residual loci are plotted in yellow. We observed an especially high correlation between a novel locus and PC4, which represents Native Hawaiian/Pacific Islander ancestry. b, The individual level data for all PAGE participants were obtained and plotted in a parallel coordinates plot, such that each PAGE individual is represented by a set of line segments connecting their eigenvalues. This allows us to see which race/ethnicity groups are differentiated at each PC. For example, we see predominantly green lines as outliers for PC4, which indicates that this vector represents a continuum of Native Hawaiian/Pacific Islander ancestry.

