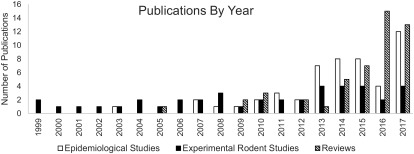
Figure 2.
Number of studies published by year and type (1999–2017). The number of studies in each evidence stream are shown by year of publication. Note: Five experimental rodent studies published before 1999 are not shown in this figure. One paper was published in each of the following years: 1974, 1979, 1984, 1985, and 1995.

