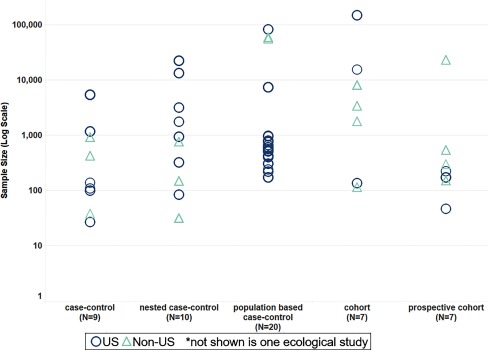
Figure 4.
Sample size by epidemiological study type. Epidemiological studies are displayed in the scatterplot based on their study design on the x-axis (case–control, nested case–control, population-based case–control, cohort, or prospective cohort) and on the number of study participants on the y-axis (log scale). Studies conducted in the United States are shown as blue circles. Studies conducted outside of the United States are shown as light-teal triangles.

