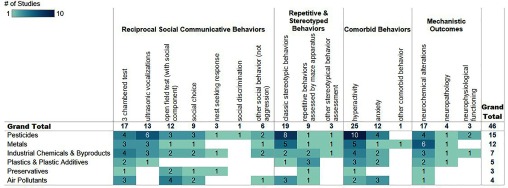
Figure 5.
Heat map of included rodent studies by exposure (in rows) and types of rodent outcomes (in columns). Numbers within cells indicate the number of studies for a given exposure and outcome. Empty cells indicate a lack of studies. An interactive version of this figure is available at https://public.tableau.com/profile/the.endocrine.disruption.exchange#!/vizhome/SupplementalFigure2_Environmentalchemicalsandautism-rodentdata/Interactive. For clarity, the different outcomes have been collapsed to the four types of outcomes that were captured in this report. Additional study information can be found in the interactive Figure S2 and in Excel Table S4.

