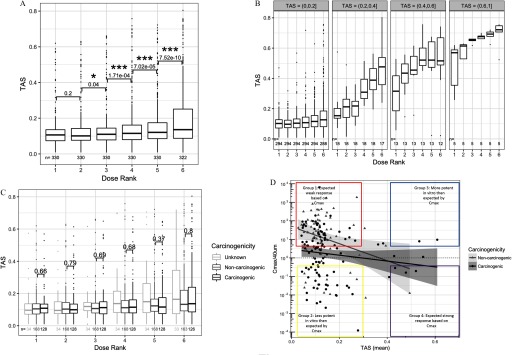
Figure 1.
Box plot of transcriptional activity scores (TAS) by sample subsets. (A) Box plot of TAS distributions for each dose level (; ). Numeric labels indicate the significance of paired one-sided two-group TAS comparison between adjacent dose groups, adjusted for multiple comparisons across doses using the false discovery rate method (FDR) (* ; *** ) (see “Methods” section). (B) Box plot of TAS distribution for each dose level, binned by TAS subsets. (C) Distribution of TAS grouped by chemical carcinogenicity within each dose level. p-Values indicate the significance of unpaired one-sided two-group TAS comparison between TAS of carcinogenic chemicals and TAS of noncarcinogenic chemicals within each dose group. (D) Scatterplot of mean TAS per chemical and the ratio of equivalent in vitro dose (Cmax) over maximum in vitro dose () (see “Methods” section for Cmax calculation). Box plots in Panels A, B, and C have the following specifications: the lower, middle, upper hinges corresponding to the 25th, 50th (median), and 75th percentiles, respectively; the upper and lower whiskers extend to the smaller and largest value at most 1.5 × IQR (interquartile range) from the hinge, and data points beyond the whiskers are represented as dots.

