. 2019 Apr 9;127(4):047002. doi: 10.1289/EHP3986

Figure 3.

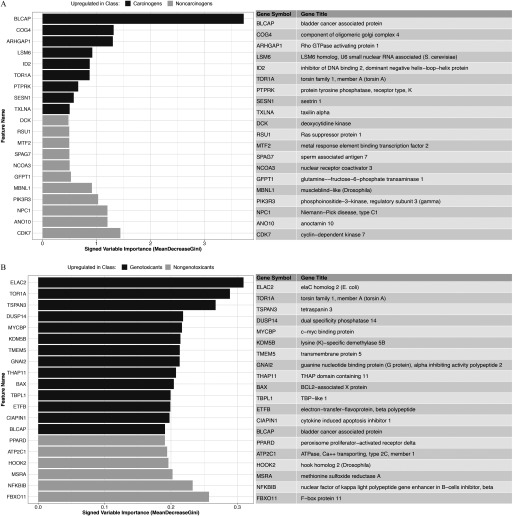
Figure 3A is a horizontal bar graph plotting feature names (y-axis) across signed variable importance (mean decrease in gini; x-axis) for the carcinogens and noncarcinogens. A tabular representation with columns labeled gene symbol and gene title lies adjacent to the bar graph. Figure 3B is a horizontal bar graph plotting feature names (y-axis) across signed variable importance (mean decrease in gini; x-axis) for the genotoxicants and nongenotoxicants. A tabular representation with columns labeled gene symbol and gene title lies adjacent to the bar graph.

Top 20 landmark gene features for prediction of (A) carcinogenicity, and (B) genotoxicity as ranked by variable importance (mean decrease in Gini index) in the predictive models of transcriptional activity scores (TAS) >0.4 subset.