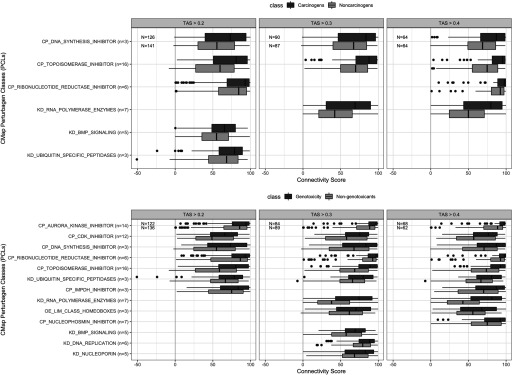
Figure 5.
Connectivity scores of top Connectivity Map (CMap) Perturbagen classes with differential connectivity [false discovery rate ] to carcinogens vs. noncarcinogens and genotoxicants vs. nongenotoxicants grouped by transcriptional activity scores (TAS) subsets. The lower, middle, and upper hinges of box plots correspond to the 25th, 50th (median), and 75th percentiles, respectively. The upper and lower whiskers extend to the smaller and largest value at most 1.5 × IQR (interquartile range) from the hinge, and data points beyond the whiskers are represented as dots.

