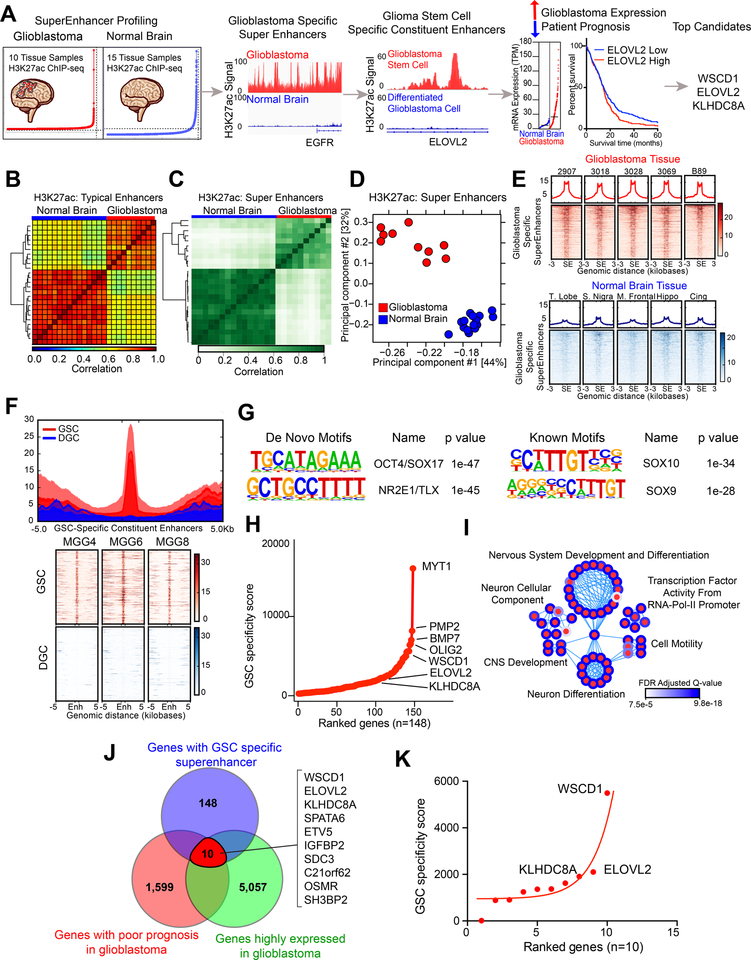
Figure 1. In silico super-enhancer screen identifies potential glioblastoma stem cell specific therapeutic targets. See also Figure S1.
(A) Diagram depicting the target selection strategy for the in silico super-enhancer screen.
(B) Clustering of 10 glioblastoma tissue samples and 15 normal brain tissue samples based on H3K27ac signal at typical enhancer regions. Color indicates the degree of Spearman correlation between individual samples.
(c) Clustering of 10 glioblastoma tissue samples and 15 normal brain tissue samples based on H3K27ac signal at super-enhancer regions defined by ROSE. Color indicates the degree of Pearson correlation between individual samples.
(d) Principal component analysis of 10 glioblastoma tissue samples and 15 normal brain tissue samples based on H3K27ac signal at super-enhancer regions defined by ROSE.
(E) H3K27ac signal over all glioblastoma-specific super-enhancers in glioblastoma tissue (upper portion, red) and normal brain tissue (lower portion, blue). Super-enhancer regions are scaled over a window 3 kilobases upstream and downstream of the super-enhancer.
(F) H3K27ac signal over all glioblastoma stem cell specific constituent enhancers in three matched glioblastoma stem cells (GSC) and differentiated glioblastoma cells (DGC) (MGG4, MGG6, and MGG8). The regions were defined by selecting all enhancers within glioblastoma specific super-enhancers as defined in (E) that were present in GSCs but absent in DGCs. GSC and DGC data was derived from (26).
(G) HOMER de novo and known motif enrichment analysis of GSC-specific enhancer constituents of glioblastoma-specific super-enhancers, as defined in (F).
(H) Hockey stick plot showing GSC specific super-enhancer associated genes ranked by “GSC specificity score,” which depended on (1) number of gained H3K27ac peaks in GSC compared to DGC within the glioblastoma specific super-enhancer and (2) the fold change mRNA difference between GSCs and DGCs for the selected gene.
(I) Pathway enrichment bubble plot shows gene sets enriched among GSC specific super-enhancer associated genes, as described in (H).
(J) Venn diagram showing the intersection between genes for which high expression is associated with poor patient prognosis as calculated by the Cox proportional hazard test and the Log-rank test.
(K) Super-enhancer screen targets ranked by GSC-specificity score.

