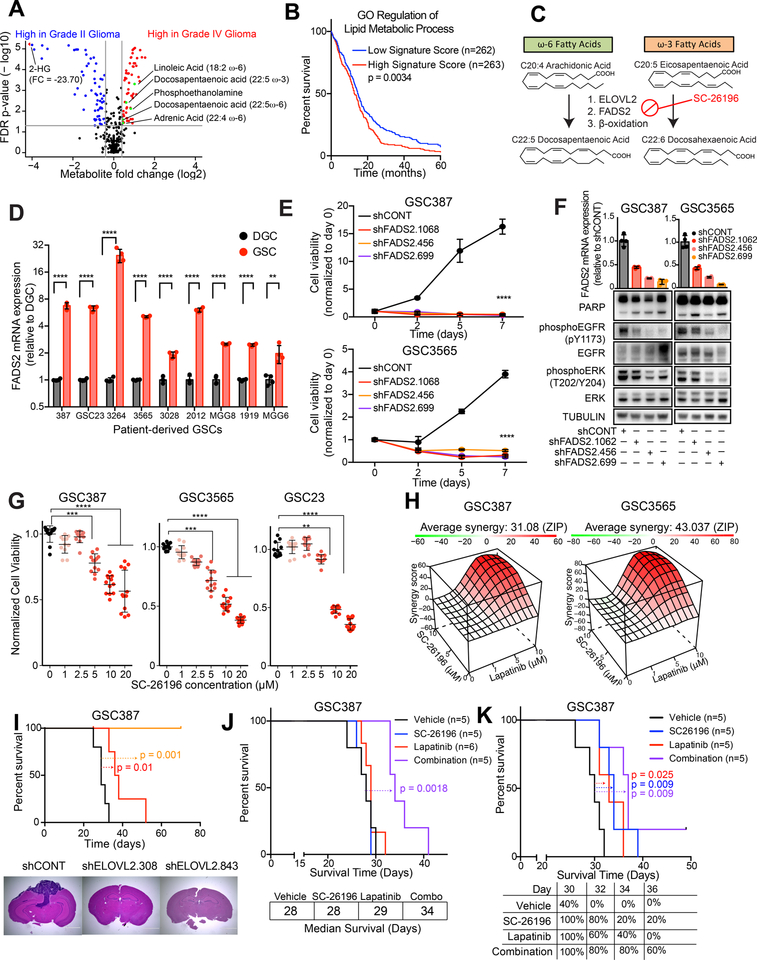
Figure 7. Polyunsaturated fatty acid synthesis is a clinical target for glioblastoma. See also Figure S8.
(A) Volcano plot showing differential metabolites between high grade glioma (grade IV) and low grade (grade II) glioma. Data was derived from (34).
(B) Kaplan-Meier curve showing survival of patients in the TCGA HG-U133A glioblastoma dataset stratified based on signature score from the “GO regulation of lipid metabolic process” signature. Log-rank analysis (p = 0.0034, “Signature low” n=262, “Signature high” n=263).
(C) Schematic showing metabolic pathways involved in ω-3 and ω-6 polyunsaturated fatty acid synthesis and mechanism of SC-26196.
(D) qPCR analysis of mRNA expression of ELOVL2 in 7 matched GSCs and DGCs with four technical replicates. Student t-test with Sidak multiple test correction, **, p < 0.01. ****, p < 0.0001.
(E) Cell viability in the GSC387 and GSC3565 cell model following knockdown with three independent, non-overlapping shRNAs targeting FADS2 (shFADS2.1062, shFADS2.456, shFADS2.699) or a non-targeting shRNA (shCONT). Two-way repeated measures ANOVA was used for statistical analysis with Dunnett’s multiple hypothesis test correction with five technical replicates (****, p < 0.0001).
(F) FADS2 mRNA expression assessed by qPCR and EGFR signaling elements assessed by western blot following knockdown with three independent, non-overlapping shRNAs targeting FADS2 (shFADS2.1062, shFADS2.456, shFADS2.699) or a non-targeting shRNA (shCONT). Tubulin was used as a protein loading control.
(G) Cell viability in three GSCs was assessed following 6 days of treatment with SC-26196 at varying concentrations. Kruskal-Wallis test with Dunn’s multiple comparisons test with four technical replicates and three biological replicates. **, p < 0.01,***, p < 0.001. ****, p < 0.0001.
(H) In vitro synergy diagram of combinatorial lapatinib and SC-26196 treatment following combinatorial treatment with lapatinib (0,1,5,10 μM) and SC-26196 (0,5,10 μM). Cell viability was assessed after 3 days of treatment. ZIP score was used to assess synergy (55).
(I) (Top) Kaplan-Meier curve showing survival of mice following implantation with GSC387 following knockdown with two independent, non-overlapping shRNAs targeting ELOVL2 or a non-targeting shRNA (shCONT). n=5 mice per arm. shCONT vs. shELOVL2.308, p = 0.01. shCONT vs. shELOVL2.843, p = 0.001. (Bottom) Hematoxylin and eosin staining of brains following implantation with GSC387 following shCONT or shELOVL2 treatment.
(J) Kaplan-Meier curve showing survival of mice following implantation with GSC387 following treatment with vehicle control, SC-26196 (10μM), lapatinib (5μM), or a combination (10 μM SC-26196 + 5 μM lapatinib) in vitro. n=5 mice for vehicle, SC26196, and combination arms. n=6 for lapatinib arm. Log-rank, p = 0.0018.
(K) Kaplan-Meier curve showing survival of mice following implantation with GSC387 and treatment with vehicle, 125 mg/kg of SC-26196, 30 mg/kg of lapatinib, or a combination (125 mg/kg of SC-26196 and 30 mg/kg of lapatinib). n=5 mice per arm. Log-rank test was used for statistical analysis. Vehicle vs. SC-26196 (p = 0.009). Vehicle vs. lapatinib (p = 0.025). Vehicle vs. combination (p = 0.009). SC-26196 vs. combination (p = 0.27). Lapatinib vs. combination (p = 0.06).

