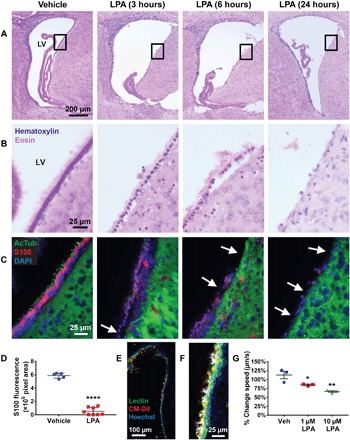
Fig. 2. LPA affects ependymal integrity.

(A) Representative images of H&E-stained lateral ventricles at 3, 6, and 24 hours after LPA exposure (magnification, ×10) (n = 5). LV, lateral ventricle. (B) Magnified regions (×63) of the boxed areas shown in (A). (C) Cilia and cell bodies of lateral ventricle ependymal cells immunostained with acetylated tubulin (AcTub) (green, cilia) and S100 (red, cell body) with 4′,6-diamidino-2-phenylindole (DAPI) nuclear counterstain (blue). The arrows point to denuded sections of the ventricular wall. (D) Quantification of ependymal cell loss in P8 mice 24 hours following injection with LPA (n = 8) or vehicle (n = 5). The area of S100 immunostaining surrounding the lateral ventricles was added over five serial sections, covering 1 mm of lateral ventricle, using ImageJ. Each symbol represents total ventricular S100 fluorescence from an individual brain. ****P < 0.0001 compared to vehicle controls. (E) Single-frame image (×20) of a lateral ventricle stained with Hoechst (blue, nuclei), Lectin DyLight 488 (green, ependymal membrane), and CM-DiI (red, cilia) taken from live ciliary imaging shown in fig. S2 and movie S1. (F) Example of tracking analysis on a single frame, with colored dots overlaying beating cilia and white tracks tracing ciliary motility patterns over 10 s, taken from movie S2. (G) Quantification of the change in average ciliary movement speed from 0 to 3 hours in vehicle- and LPA-treated wells (n = 3). Symbols represent values from brain slices of the same three mice treated with vehicle, 1 μM LPA, or 10 μM LPA. (D and G) *P < 0.05 and **P < 0.005 compared to vehicle controls, as determined by analysis of variance (ANOVA) with Tukey’s post hoc test.
