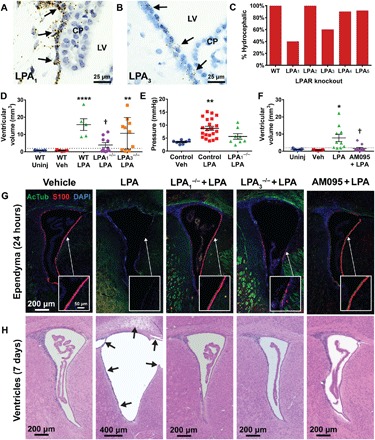
Fig. 4. LPA1 and LPA3 are involved in hydrocephalus development.

Specific LPAR expression in the ependyma was demonstrated by RNAscope for (A) Lpar1 and (B) Lpar3, (brown RNA probes with blue nuclear counterstain). CP, choroid plexus. (C) LPA was injected into specific LPAR knockout mice, and the incidence of hydrocephalus was reported as determined by VM analysis (n = 10 for LPA1-LPA4 and n = 11 for LPA5). (D) Quantification of VM in LPA1 and LPA3 knockout mice 7 days following vehicle or LPA exposure. WT, n = 5; null, n = 10. **P < 0.01 and ****P < 0.0001 versus WT vehicle-injected animals. †P < 0.001 versus WT LPA-injected. (E) ICP measurements of LPA1-null mice compared to littermate and vehicle controls 7 days after injection. n = 7 vehicle-injected pups, n = 21 LPA-injected littermates, and n = 5 LPA-injected LPA1−/− pups. **P < 0.005 compared to vehicle controls. (F) VM quantified in mice treated with AM095 or vehicle 15 min before injection of 500 μM LPA in 0.01% bovine serum albumin (BSA). n = 9 uninjected, n = 5 vehicle, n = 10 LPA, and n = 10 AM095 + LPA. *P < 0.05 compared to vehicle control and †P < 0.05 compared to LPA-injected WT. (D to F) Symbols indicate values from individual mice. Dotted lines indicate 2 SDs above the vehicle mean. (G) AcTub (green) and S100 (red) ependymal staining 24 hours after injection (×10 magnification with ×63 insets). (H) H&E-stained lateral ventricle sections 7 days after injection. Arrows indicate areas of disrupted histology.
