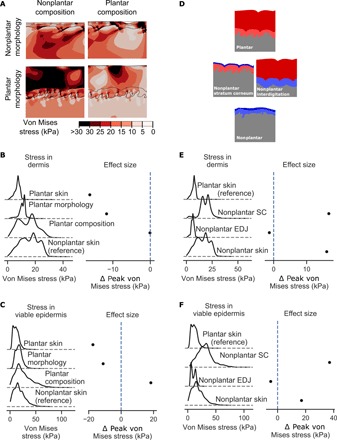
Fig. 5. Plantar skin morphology protects it from stress-induced injury.

(A) Stresses induced in plantar (bottom right) and nonplantar skin (top left) under equal compressive and shear loads. Contour plots show the distribution of von Mises stresses in the skin. Plantar composition (via the material properties) was combined with nonplantar morphology (top right) and vice versa (bottom left). (B) Kernel density estimates showing the distribution of stress magnitudes in the dermis and (C) viable epidermis. Difference in peak stress (defined as 95th percentile value) between each model and nonplantar skin is also shown (lines indicate 95% bootstrapped confidence interval of the difference). (D) Knockout models of plantar skin were created by reducing the thickness of the stratum corneum to that of nonplantar skin or reducing the interdigitation between the epidermis and dermis. (E) Kernel density estimates of the stress in the dermis and (F) viable epidermis for knockout models. Difference in peak stress is presented relative to plantar skin. Peak von Mises stresses are statistically significantly different between all models in this analysis (P < 0.0001, two-sided Student’s t test) due to the very high number of sampling points (n = 5402 and 8845 for plantar and nonplantar models, respectively). Because the number of sampling points for these simulations is arbitrary, effect size is reported in this figure rather than statistical significance.
