
Fig. 1. Nicotine withdrawal alters microglial morphology and induces reactive oxygen species in the nucleus accumbens.
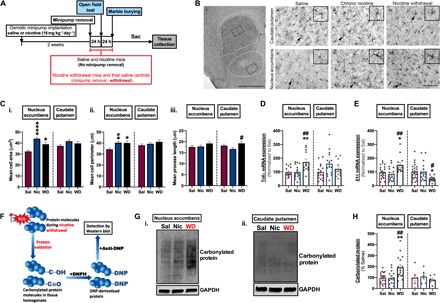
(A) Experimental design. (B) Representative images of IBA1-positive microglia. (i) White dotted traces delineate the caudate putamen (dorsal) and nucleus accumbens (ventral); black dotted traces indicate the area where (ii) to (vii) were taken. Scale bar, 1 mm. Caudate putamen of (ii) saline (Sal) mice, (iii) nicotine (Nic) mice, and (iv) nicotine withdrawal (WD) mice. Nucleus accumbens of (v) Sal mice, (vi) Nic mice, and (vii) WD mice. Scale bar, 100 μm. (C) Quantitation of (B, ii to vii). (i) Cell area (soma size), (ii) cell perimeter, and (iii) process length. Bar charts showing expression of (D) TNFα mRNA and (E) IL-1β mRNA in the nucleus accumbens and caudate putamen. (F) Schematics showing mechanism of reactive oxygen species detection by protein carbonylation assay (protein and arrow icons were downloaded from Reactome (31). (G) Representative immunoblot showing carbonylated protein levels: (i) nucleus accumbens and (ii) caudate putamen. (H) Quantitation of (G). [Compared to Sal—*P < 0.05, **P < 0.01, ****P < 0.0001; compared to Nic—#P < 0.05, ##P < 0.01; (C) n = minimum of 116 cells were quantified from four to eight animals per treatment group; (D and E) n = 12 to 24 per treatment group; (H) n = 6 to 19 per treatment group.]