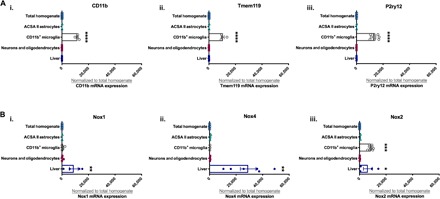
Fig. 4. Nox2 is expressed in microglia.

(A) Bar graph showing qPCR analysis of microglia markers in the liver, brain cell types, and tissue (total homogenate). (i) CD11b, (ii) Tmem119, and (iii) P2ry12. (B) Bar graph showing qPCR analysis of Nox isoforms in the liver, brain cell types, and tissue. (i) Nox1, (ii) Nox4, and (iii) Nox2. [Compared to total homogenate—*P < 0.05, **P < 0.01, ***P < 0.001, ****P < 0.0001; (A and B) n = 2 to 9 per treatment group.]
