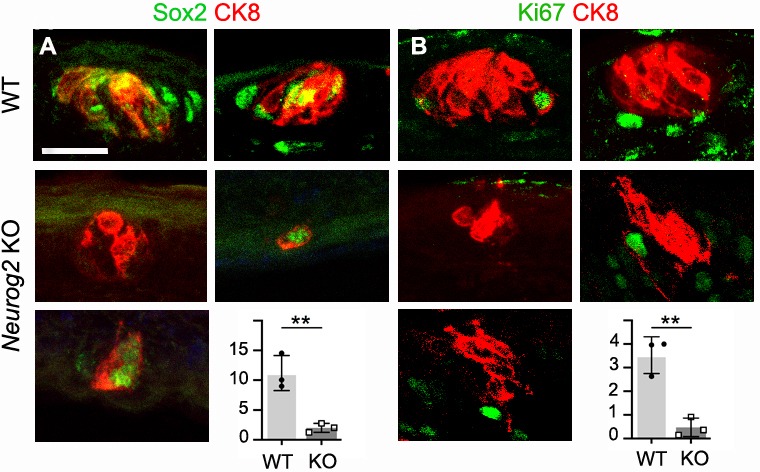
Figure 4. Taste nerves are required for Sox2 expression and cell proliferation around taste bud anlagen.

(A,B) Immunofluorescence against CK8 and Sox2, or CK8 and the proliferation marker Ki67 on representative CK8+ cell clusters in the soft palate from wild type, and Neurog2 KO, at E18.5. The graphs show the counts of Sox2High and Ki67+ cells inside or within two cell diameters of CK8+ cell clusters. **: p<0.01; error bars presented as mean ± SD (for Sox2High cells, a sample of 72 wild type and all (n = 100) mutant clusters were counted, on three animals; for Ki67+ cells, a sample of 71 wild type and all (n = 101) mutant clusters were counted on three animals). The individual results for each animal are represented by dots. Scale bar: 20 μm.
