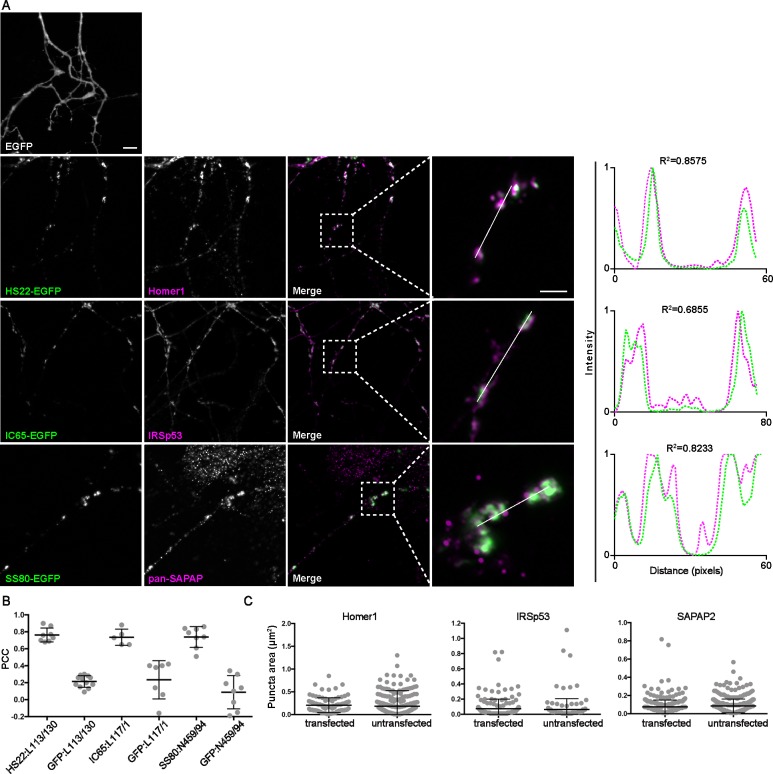
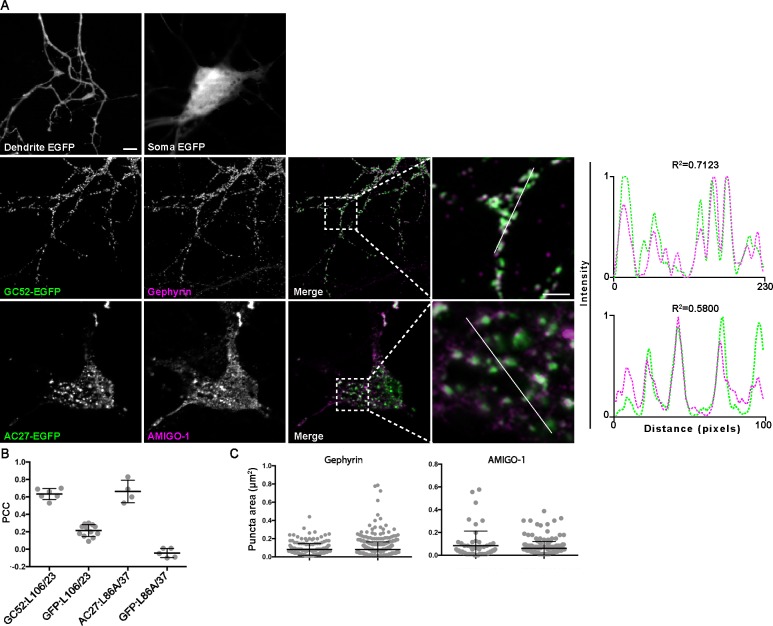
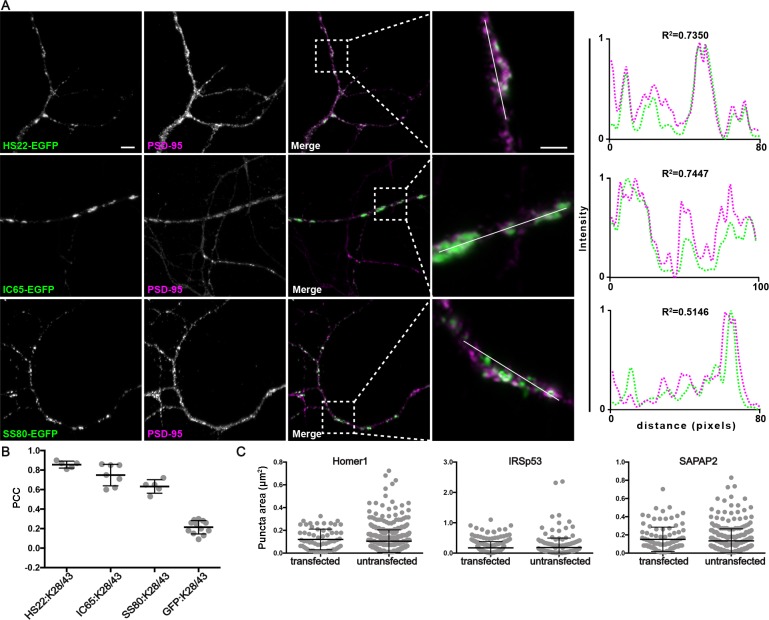
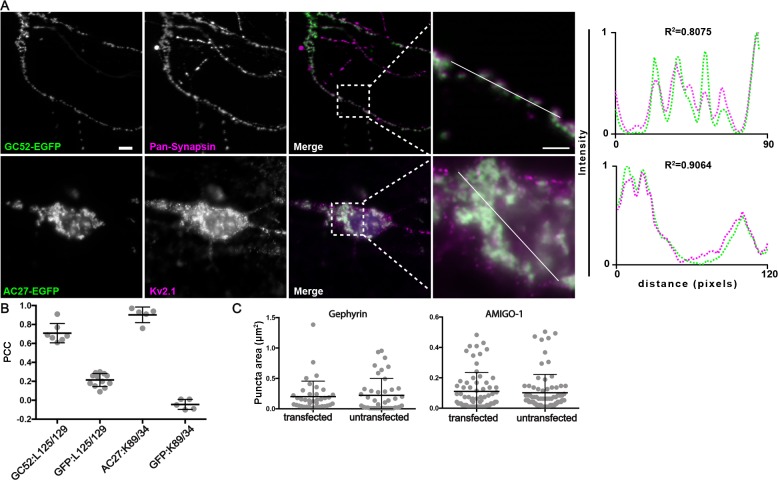
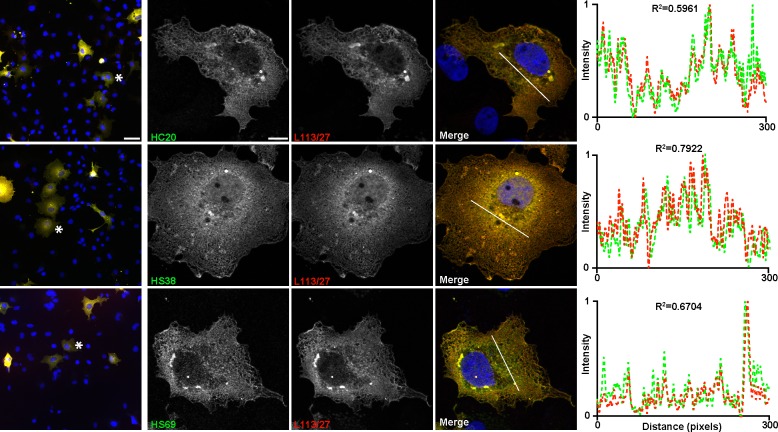
Representative images of intrabody-positive nAbs bound to endogenous excitatory synapse targets after expression in cultured hippocampal neurons. (A) The top left panel shops the pattern of EGFP expression in the dendrites of a transfected neuron. The subsequent rows show neurons expressing nAb-EGFP fusions and showing EGFP fluorescence (green), target-specific mAb labeling (magenta), and the merged image, with an adjacent panel showing a magnified image of the inset marked by the dashed box. Panels to the far right of each row are the normalized fluorescence intensity values across the individual line scans from the magnified inset, with the corresponding R2 values. Note the concordance of the magenta and green intensity values for the target and the positive nAb-EGFP fusions, but not for EGFP itself. The scale bar in the top left panel is 5 μm and holds for all panels in figure except the magnified insets, for which the scale bar is 2 μm. (B) Graph of Pearson’s Correlation Coefficient (PCC) values between nAb-EGFP and anti-target mAb labeling (Homer1: L113/130; IRSp53: L117/1; pan-SAPAP:N459/94). PCC values of Homer1 and IRSp53 mAb immunolabeling with EGFP fluorescence in cells expressing EGFP are also shown. (C) Size analysis of mAb-labeled puncta of target proteins between nAb-EGFP transfected and untransfected cells. Homer1: ns, p=0.3828; IRSp53: ns, p=0.5410; pan-SAPAP: ns, p=0.0706; two-tailed unpaired t-tests. Bars on all graphs are mean ± SD.
