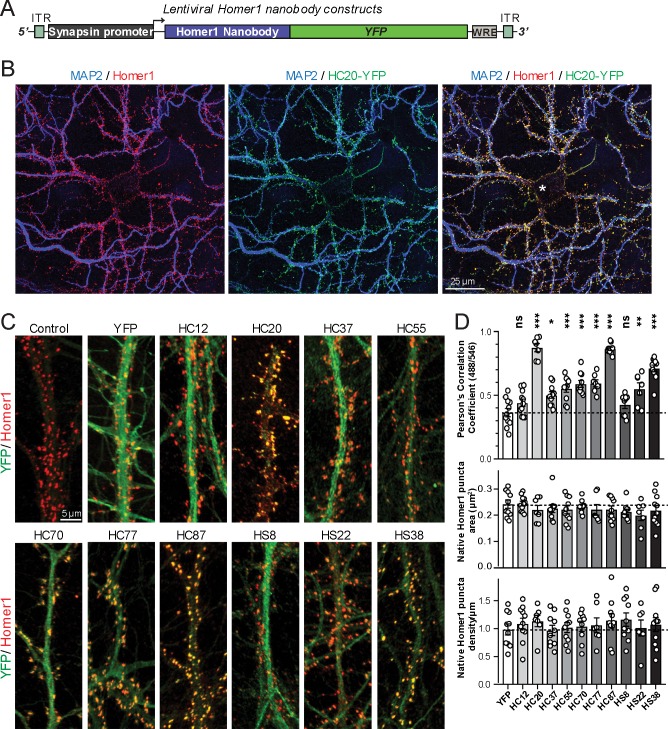
Figure 2. Anti-Homer nAbs expressed as intrabodies from recombinant lentivirus target to dendritic spines in cultured hippocampal neurons.
(A) Schematic of the lentivirus targeting construct. (B) Image shows a representative field of a CHN culture infected at 5 days in vitro (DIV) with recombinant lentivirus encoding the anti-Homer1 HC20-YFP nAb fusion (green) and imaged at 14 DIV after immunolabeling for endogenous Homer1 (red) and the dendritic marker MAP2 (blue). (C) Images show representative fields of dendrites of infected CHNs expressing different nAb-YFP fusions as indicated (green) and immunolabeled for endogenous Homer1 (red). The scale bar in the top left Control panel is 5 μm and holds for all panels in C. (D) The top graph shows Pearson’s Correlation Coefficient values between YFP or the different nAb-YFP fusions and anti-Homer1 immunolabeling. *p<0.01; **p<0.001; ***p<0.0001 for values of different anti-Homer1 nAb-YFP fusions versus for YFP alone. ns = not significant versus YFP alone. Values were analyzed by a one-way ANOVA followed by a Dunnett's post hoc test. The middle graph shows a size analysis of anti-Homer1 Ab labeled synaptic puncta in CHNs expressing YFP or the different anti-Homer1 nAb-YFP fusions. The bottom graph shows the density of anti-Homer1 Ab labeled synaptic puncta in CHNs expressing YFP or the different anti-Homer1 nAb-YFP fusions. Values for the size and density of anti-Homer1 Ab labeled synaptic puncta in CHNs expressing different anti-Homer1 nAb-YFP fusions are not significantly different than in CHNs expressing YFP alone. Bars on all graphs are mean ± S.E.M.

