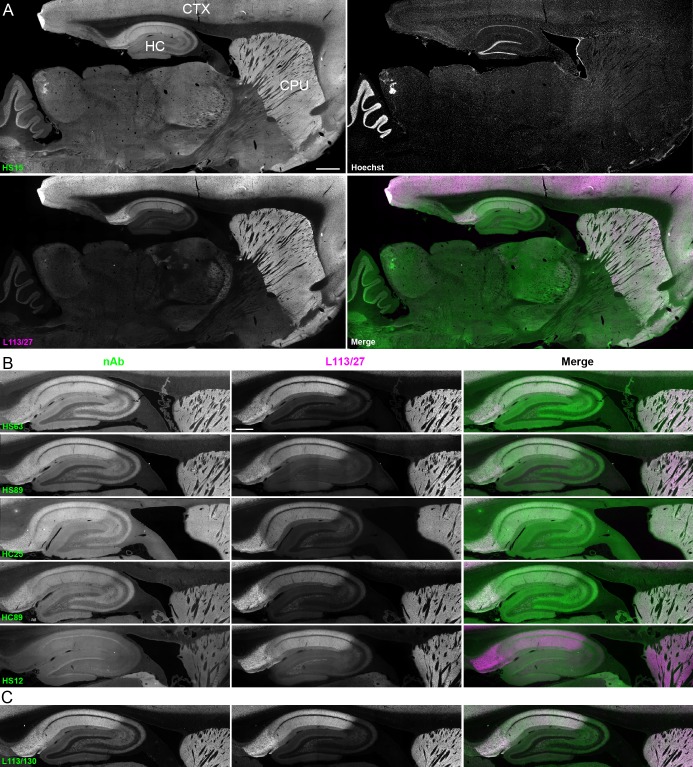
Figure 4. nAbs against Homer1 label rat brain sections through fluorescent immunohistochemistry.
(A) Representative images of a whole brain section labeled with a nAb BC supe against Homer1 (HS15, in green), a mouse mAb against Homer1 (L113/27, in magenta) and a nuclear label (Hoechst, in grayscale) showing brain regions with high Homer1 labeling. Merge is of antibody labeling only. CPu = caudate putamen; CTX = cerebral cortex; HC = hippocampus. The scale bar in the HS15 panel is 1 mm and holds for all four panels. (B) Representative images of HC and CPu from brain sections labeled with several anti-Homer1 nAb BC supes (green) and a mouse mAb against Homer1 (L113/27, in magenta). Note that nAb HS12 was scored as negative in this application. The scale bar in the top L113/27 panel is 500 μm and holds for all panels in B and C. (C) Representative images from brain sections labeled with mouse mAb L113/130 that recognizes both the long and short splice variants of Homer1 (green), and mouse mAb L113/27 that recognizes only the long splice variants of Homer1 (magenta).

