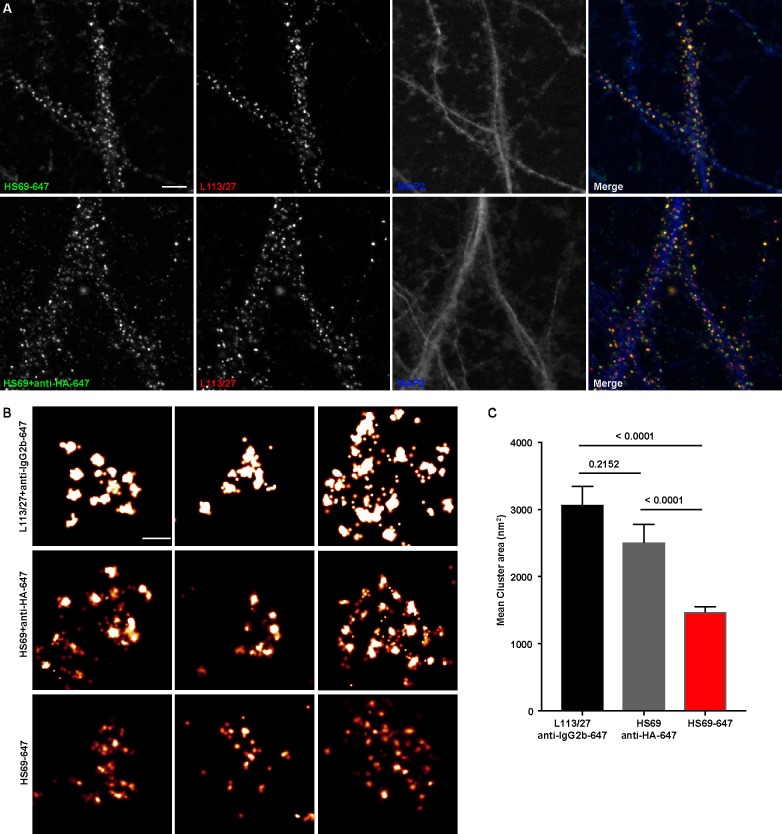
Figure 5. Immunolabeling with nAbs enhances spatial resolution.
(A) Representative TIRF images of CHNs. Neurons were immunolabeled with anti-Homer1 nAb plus a mouse mAb against Homer1 (L113/27, in red), and an antibody against MAP2 (blue). Top row: Dendrites of a CHN immunolabeled with nAb HS69 directly conjugated to Alexa647 (HS69-647, in green). Bottom row: Dendrites of a CHN immunolabeled with HA-tagged HS69 nAb plus Alexa647 conjugated anti-HA mAb (HS69 + anti-HA-647, in green). Scale bar is 5 μm and holds for all panels in A. (B) Representative super-resolution Homer1 localization maps of neurons immunolabeled for Homer1 with a mouse mAb plus Alexa647-conjugated secondary Ab (L113/27 + anti IgG2a-647), with HS69 nAb plus Alexa647-conjugated anti-HA antibody (HS69 + anti-HA-647), or with directly Alexa647-conjugated HS69 nAb (HS69-647). Scale bar is 200 nm and holds for all images in panel B. (C) Bar plot of the mean Homer1 cluster area ± SD for the three different labeling groups described in B (n = 227, 403, and 593 clusters respectively from five different cells per group). p values were calculated using a one-way ANOVA and a Bonferroni’s multiple comparisons test.

