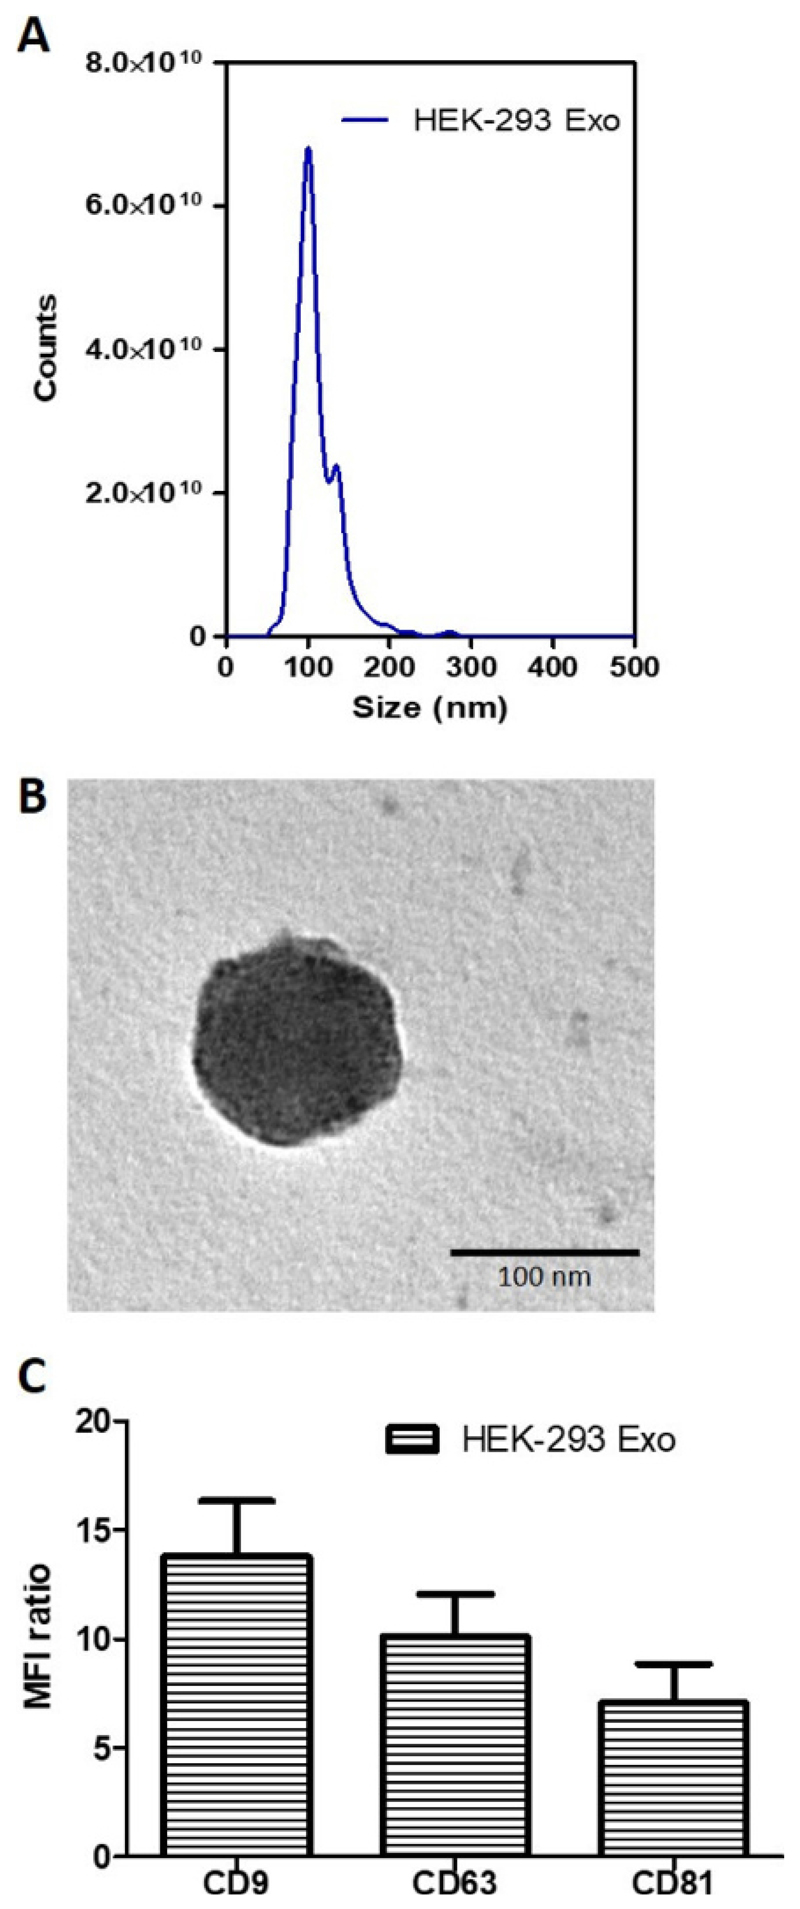
Figure 3. Biochemical and morphology analysis of HEK-293 exosomes.
(A) Size distribution of HEK-293 exosomes using Nanoparticle Tracking Analysis (NTA). The curve shows a superimposed histogram from 3 different captures at 30 s interval with red areas denoting standard deviation between measurements (n = 3). (B) Transmission Electron Microscopy (TEM) images of the naïve HEK-293 exosomes. Scale bar: 100 nm. (C) Detection of exosomal markers CD81, CD9 and CD63 using flow cytometry on HEK-293 exosomes. Exosomes were coupled to aldehyde/sulphate latex beads prior to detection. Exosome-beads complex were subsequently stained with fluorophore-conjugated anti-CD81, anti-CD9 and anti-CD63 antibodies. Degree of expression of the markers are expressed as the fold difference in median fluorescence intensity (MFI) values from that of the control (exosome-beads complex stained with the corresponding isotype). Values are expressed as mean ± SD, where n = 3.

