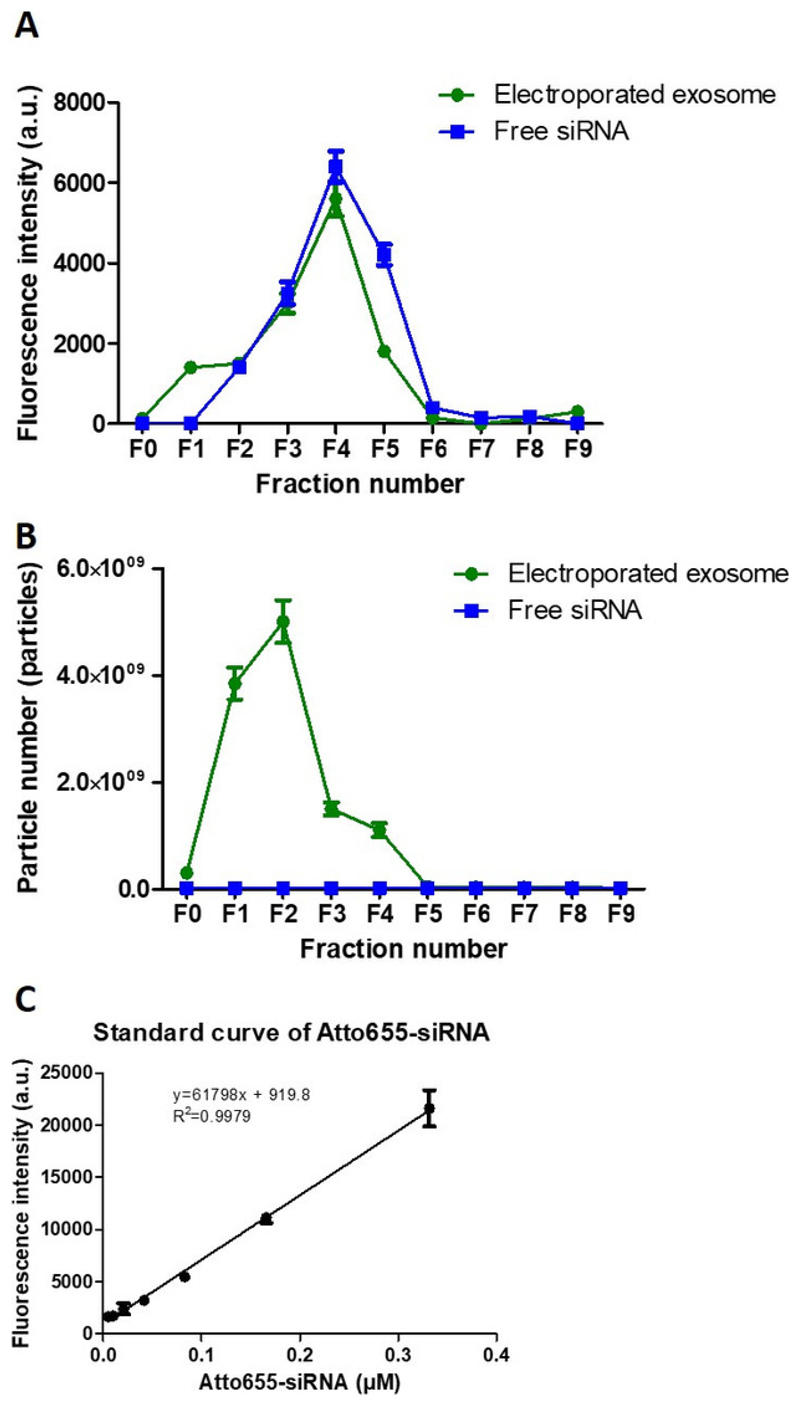
Figure 4. Exosome purification post-electroporation.
(A) Elution profiles (F0-F9) of Atto655-siRNA and electroporated exosomes using size exclusion chormatography. (B) NTA analysis of both Atto655-siRNA and exosome from F0 to F9 using size exclusion chormatography. (C) The calibration curve of Atto655 labelled siRNA. Fluorescence intensities were obtained by plate reader at Ex/Em: 640-10/680 nm; Gain 2800. Values are expressed as mean ± SD (n = 3).

