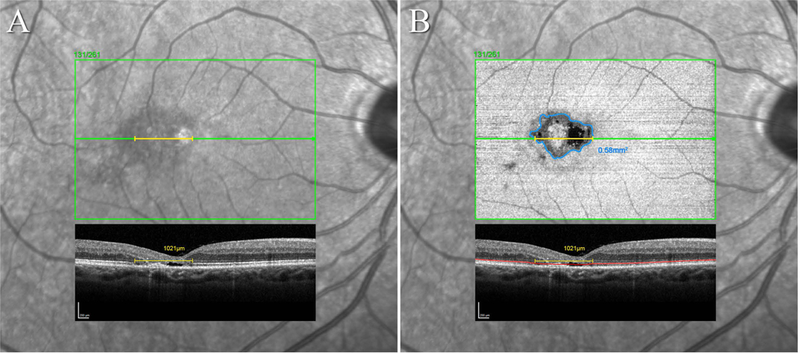
Figure 1. Linear and area measurements of the EZ break in SD-OCT volume scans.

A: Infrared SLO image with the position marker of the OCT volume scan and B-scan #131/261 traversing the foveal center superimposed. The caliper tool (yellow) was used to measure the lateral linear extent of the EZ break in this B-scan. B: The EZ en face image superimposed over the IR image in A. The EZ segmentation line is marked within the B-scan in red, the boundary of the break within the en face image of the EZ in blue. In this case, the EZ break also affects the foveal center. Only areas where the EZ was no longer apparent in the B-scan were accepted as a clear break. Mere attenuations of a signal still present were not accepted as a full EZ break (e.g. smaller dark areas infero-temporal to the main lesion in the en face image in B. These may however be early signals of a developing break).
