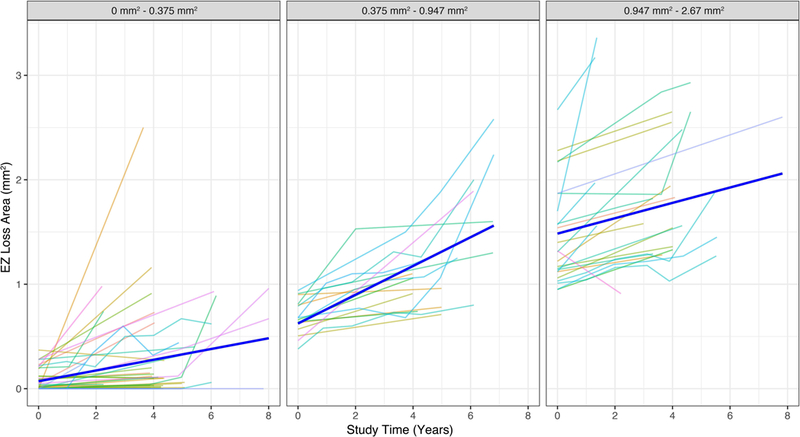
Figure 3. Observed and predicted growth curves at different initial break areas.

These line plots show the observed progression patterns of the EZ break area (thin colored lines) and the average predicted patterns form the model (bold blue lines) at different initial break area sizes. Note how the predicted progression pattern estimated by the model changes in each initial break area group (0–0.375mm2, 0.375–0.947mm2, and 0.947–2.67mm2). This effect is indicating a non-linear progression of EZ break area that increases exponentially over time before reaching a plateau.
