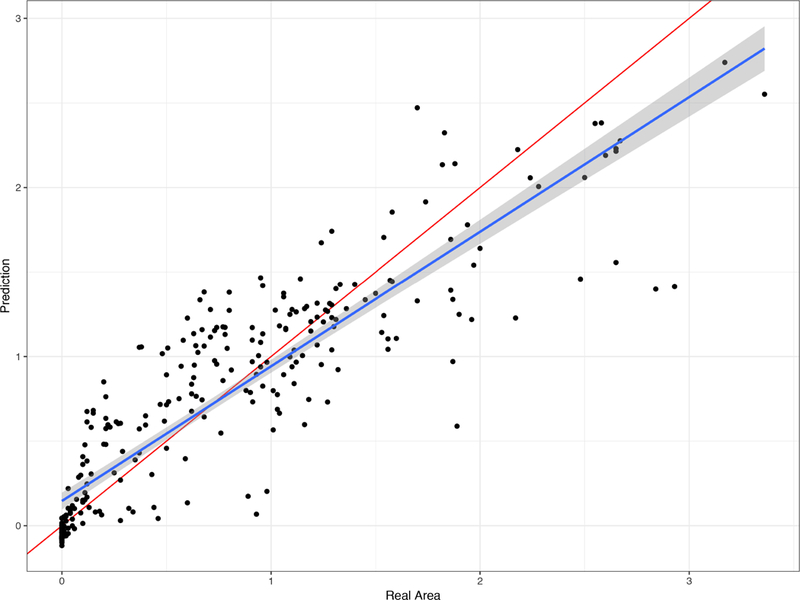
Figure 4: Relationship between real break areas and break areas predicted based on break length.

This figure demonstrates the relationship of predicted beak area values (based on break length) and the real observed break area. Each dot represents one such data pair, predicted size on the Y axis, measured size value on the X axis (both axes in mm2). This figure also includes the estimated relationship between the predicted and the true areas (blue line) as well as the identity line (red line). Note how the relationship between linear and predicted areas overlaps with the identity line, indicating a strong predicting power.
