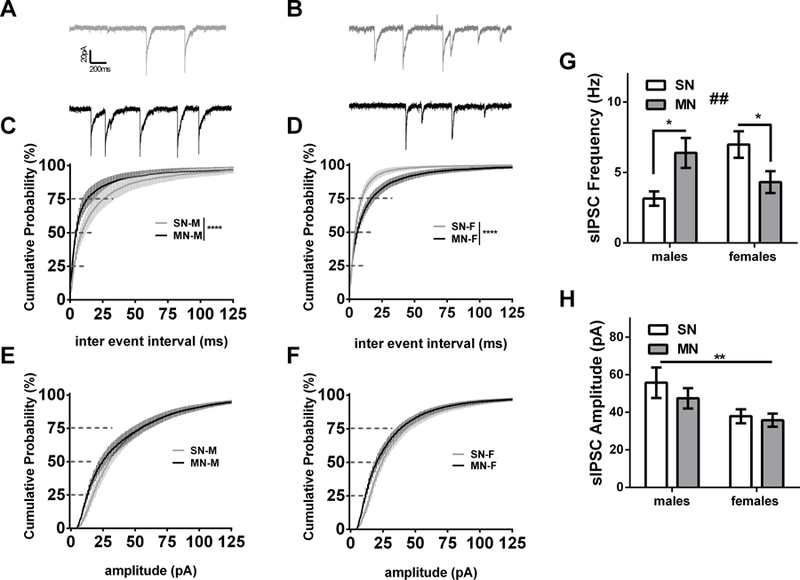
Figure 4:

Morphine withdrawal differentially alters BNST spontaneous GABAergic transmission in male and female mice. A) Representative currents (SN-M gray, MN-M black) B) Representative currents (SN-F gray, MN-F black) C) Cumulative distribution plot comparing sIPSC inter event interval in males (**** p<0.0001, SN-M n=14; MN-M n=22). D) Cumulative distribution plot comparing sIPSC inter event interval in females (**** p<0.0001.SN-F n=17; MN-F n=19). F) Cumulative distribution plot comparing sIPSC amplitude in females from same cells as D. E) Cumulative distribution plot comparing sIPSC amplitude in males from the same cells as C. Bar graph of sIPSC frequency cell averages (## drug by sex interaction p<0.01, * P<0.05) F) Bar graph of sIPSC amplitude cell averages had main effect of sex (** p<0.01).
