Fig. 7.
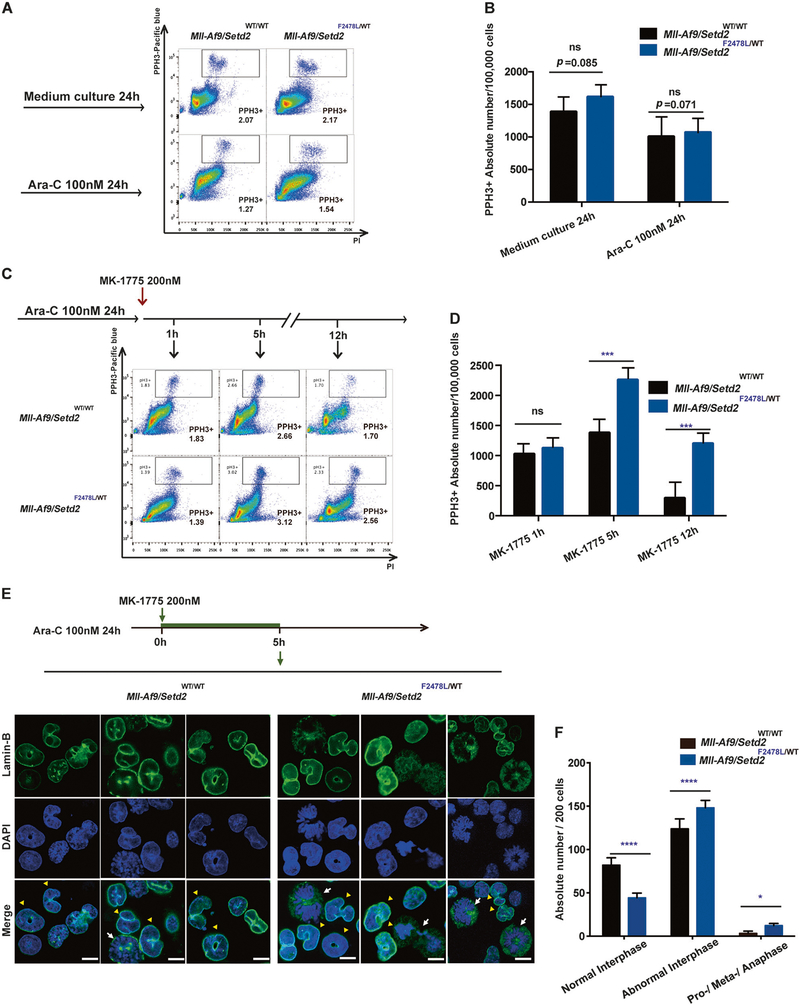
Checkpoint inhibition increases mitotic catastrophe in chemotreated cells. a Flow cytometry analysis of the phospho-Histone H3 (PHH3)-positive (PHH3+) mitotic population (indicated by boxes) in Mll-Af9 and Mll-Af9/Setd2F2478L/WT primary cells after exposure to culture medium alone or Ara-C treatment for 24 h. b The total number of PHH3+ cells in Mll-Af9 and Mll-Af9/Setd2 F2478L/WT primary cells in (a) were calculated and illustrated. c After Mll-Af9 and Mll-Af9/ Setd2F2478L/WT primary cells were treated with Ara-C for 24 h, the WEE1 inhibitor MK-1775 was added and cells were collected at 1, 5, and 12 h from the same culture for pHH3+ analysis. d Total number of PHH3+ cells in Mll-Af9 and Mll-Af9/Setd2F2478L/WT primary populations in (c) were illustrated and calculated. e After Mll-Af9 and Mll- Af9/Setd2F2478L/WT primary cells were treated with Ara-C for 24 h, MK-1775 was added and the cells were collected at 5 h for confocal analysis. Mitotic catastrophe is visualized by micronucleation detected with an antibody against Lamin B (green). Nuclei or condensed chromosomes are shown by counterstaining with DAPI (blue). Scale bar indicates 10 μm. Yellow triangles are used to show abnormal interphase cells; white arrows are used to show pro-/meta-/anaphase cells. f Representative data of three independent experiments in (e) are shown. In total, 200 cells per slide were counted. Three biological replicates of each genotype are performed in triplicate and the data are presented as the mean ± SD values. *P < 0.05; ***P < 0.001; ****P < 0.0001

