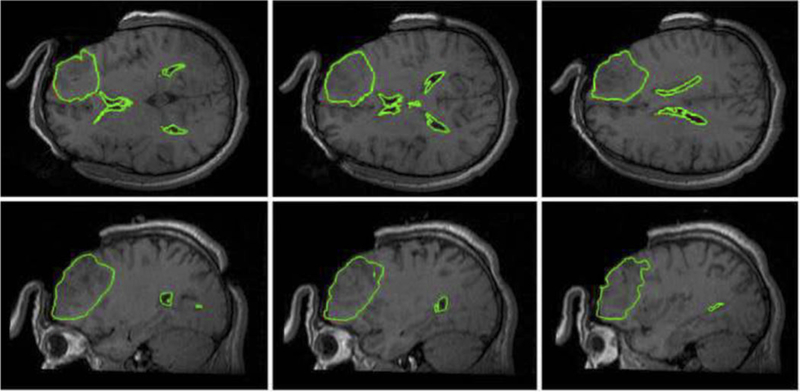
Figure 10.
Intraoperative MRIs overlaid with contours (green lines) of the deformed tumor and ventricle surfaces as generated by our MTLED-based suite of algorithms. The three transverse sections (top row) and three sagittal sections (bottom row) were taken at 5 mm intervals. For reference, the red lines represent the contours of the deformed ventricles and tumor computed by FEM, but these are almost entirely obscured by the very similar MTLED results.

