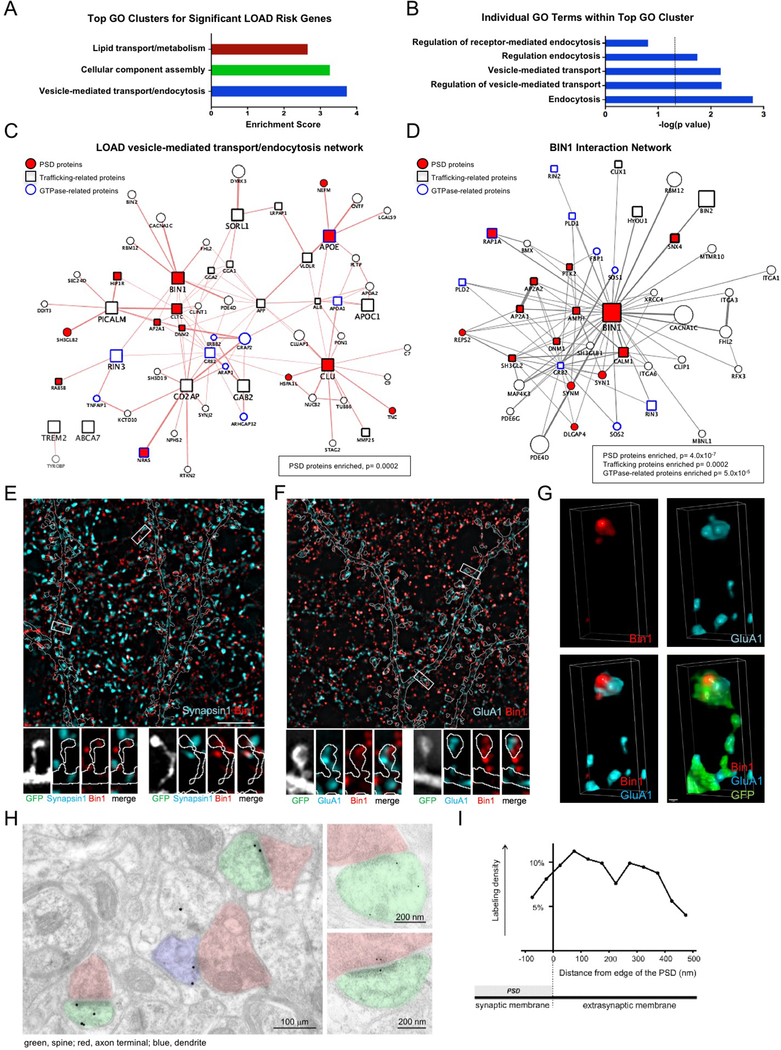
Fig 1. Postsynaptic localization of trafficking-related LOAD risk factor Bin1.
(A) The top 3 GO biological clusters of 40 genes identified in GWAS studies of LOAD risk.
(B) Top 5 individual GO terms within the top GO cluster. The dotted line indicates significance level of P= 0.05.
(C) Protein interaction network of 11 LOAD risk genes present in the vesicle-mediated transport/endocytosis GO cluster. Network was generated using the GeneMANIA in Cytoscape. This network has a significant enrichment of proteins present in the PSD (P=0.0002).
(D) BIN1 protein interaction network reveals a significant enrichment of PSD genes (P= 4.0×10⁻⁷), trafficking genes (P= 0.0002), and GTPase-related genes (P= 5.0×10⁻⁵).
(E) Top: Single plane SIM image of a dendritic region stained for Bin1 and presynaptic marker synapsin1. GFP cell fill is outlined (see Fig S1A). Scale bar = 5 μm
Bottom: Representative SIM images of boxed spines in above image.
(F) Top: Single plane SIM image of a dendritic region stained for Bin1 and GluA1. GFP cell fill is outlined (see Fig S1B). Scale bar = 5 μm
Bottom: Representative SIM images of boxed spines above image.
(G) Representative 3D reconstruction of a stack of SIM images showing the relative localization of Bin1 and GluA1 within a spine. Scale bar = 50 nm
(H) Immuno-electron microscopy for Bin1. Left micrograph is low-magnification view of neuropil. Labeled spines have been colorized green and axon terminals pink; a thin immunopositive dendritic process (left) is colorized blue.
(I) Bin1-associated gold particles in immuno-EM images are found in the synaptic membrane/PSD, as well as near the PSD in extrasynaptic membranes.

