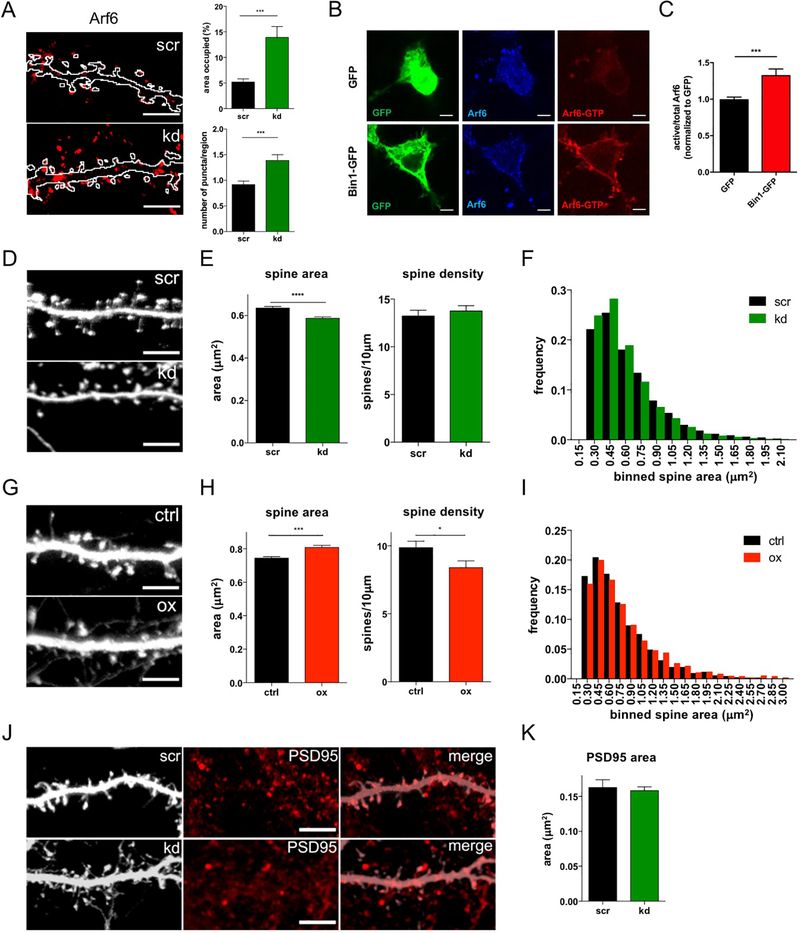
Fig 3. Bin1 regulates Arf6 and dendritic spine morphology.
(A) Left: Representative flattened confocal images of Arf6 staining in GFP filled control (scr) and Bin1 knockdown (kd) neurons. The outline indicates the GFP-cell fill (see Fig S3C). Scale bar = 10 μm
Right: Quantification of area occupied by and number of Arf6 positive puncta in scr and kd neurons (scr: n = 19 cells, kd = 17 cells). Area occupied: Mann-Whitney test; Puncta number: Welch’s t-test *** P<0.001
(B) Representative single plane confocal images showing total and active Arf6 staining in N2A cells with and without Bin1-GFP transfection. Scale bar = 5 μm
(C) Quantification of active/total Arf6 ratio in N2A cells transfected with GFP (n=16 cells) or Bin1-GFP (n=16 cells). All results were normalized to the average of the value of GFP transfection condition for each experiment. Mann-Whitney test *** P<0.001
(D) Representative flattened confocal images of dendrites in GFP-filled neurons expressing scrambled (scr) or Bin1 knockdown (kd) plasmids. Scale bar = 10 μm
(E) Quantification shows that knockdown of Bin1 decreases spine size without altering spine density (n = 26 cells for each condition). Spine size: Mann-Whitney test; Spine density: unpaired t-test **** P<0.0001
(F) Histogram showing frequency distribution of all individual spine areas measured in (E) (scr: n = 1049 spines, kd: n = 1120 spines).
(G) Representative flattened confocal images of dendrites in GFP-filled neurons in control (ctrl) and Bin1 overexpressing (ox) neurons. Scale bar = 10 μm
(H) Quantification shows that overexpression of Bin1 leads to decreased spine density and increased spine size (ctrl: n = 24 cells, ox: n = 20 cells). Spine size: Mann-Whitney test; Spine density: unpaired t-test * P<0.05, *** P<0.001
(I) Histogram showing frequency distribution of all individual spine areas measured in (H) (ctrl: n = 2407 spines, ox: n = 1740 spines)
(J) Representative flattened confocal images of PSD95 in scr and kd GFP-expressing neurons. Scale bar = 10 μm
(K) The size of PSD95 puncta is not altered in Bin1 knockdown neurons (scr: n = 10 cells, kd = 12 cells). Welch’s t-test.

