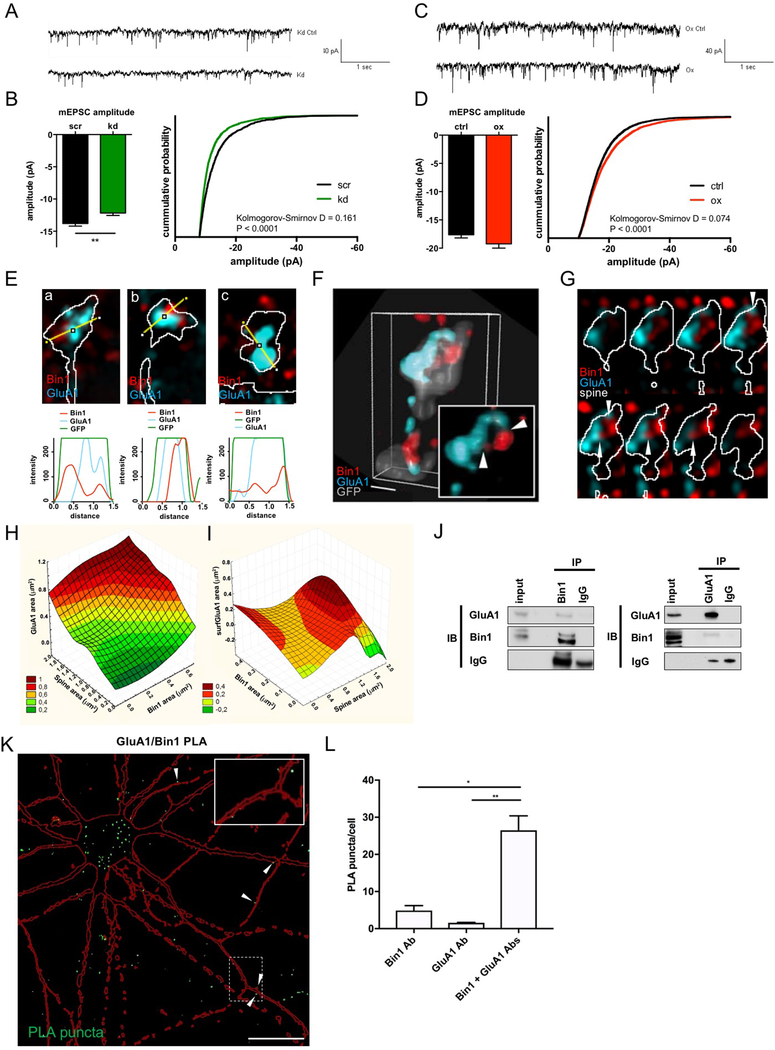
Fig. 4. Bin1 regulates glutamatergic neurotransmission and interacts with the AMPAR subunit GluA1.
(A) Representative traces of currents recorded from scr and kd treated cortical neurons
(B) Quantification of AMPA mEPSCs in cortical neurons reveals a significant reduction of mEPSC amplitude upon Bin1 knockdown (kd) (scr: n = 14 cells, kd = 22 cells). Unpaired t-test ** P<0.01
(C) Representative traces of currents recorded from control and Bin1 overexpressing (ox) cortical neurons
(D) Quantification of AMPA mEPSCs shows that Bin1 overexpression does not affect average mEPSC amplitude but shifts distribution of values toward more high amplitudes (scr: n = 24 cells, kd: n = 22 cells). Mann-Whitney test.
(E) Representative single plane SIM image of individual spines and line scans showing areas of colocalization between Bin1 and GluA1.
(F) Representative 3D reconstruction of a stack of SIM images, showing the relative localization of Bin1 and GluA1 in spines. Inset, higher-magnification view; scale bar = 50 nm.
(G) Montage of spine depicted in (F) to illustrate GluA1 and Bin1 contact sites (white arrowheads).
(H) 3D surface plot showing total area of GluA1 staining (y-axis) as a function of both spine area (x-axis) and total area of Bin1 staining (z-axis). Legend shows color-coding for y-axis values on graph.
(I) 3D surface plot showing total area of surface GluA1 (surfGluA1) staining (y-axis) as a function of both total area of Bin1 staining (x-axis) and spine area (z-axis). Legend shows color-coding for y-axis values on graph.
(J) Reciprocal coimmunoprecipitation of Bin1 and GluA1 from rat cortex homogenate suggests participation in common complexes.
(K) Flattened confocal image showing proximity-ligation assay (PLA) reveals an interaction of Bin1 and GluA1 in rat cortical neuron cultures, reflected by green PLA puncta. Red outline represents mCherry cell-filled pyramidal neuron. White arrowheads denote instances of interaction sites at dendritic spines. Inset: Zoomed in view of PLA puncta in dendritic spines and shaft. Scale bar = 20 μm
(L) Quantification of PLA puncta normalized to number of cell bodies in the imaging frame (identified by DAPI nuclear staining). Bin1 Ab and GluA1 Ab conditions represent negative controls where each antibody was used singly in the PLA assay. Kruskal-Wallis with Dunn’s post-hoc tests * P<0.05, ** P<0.01

