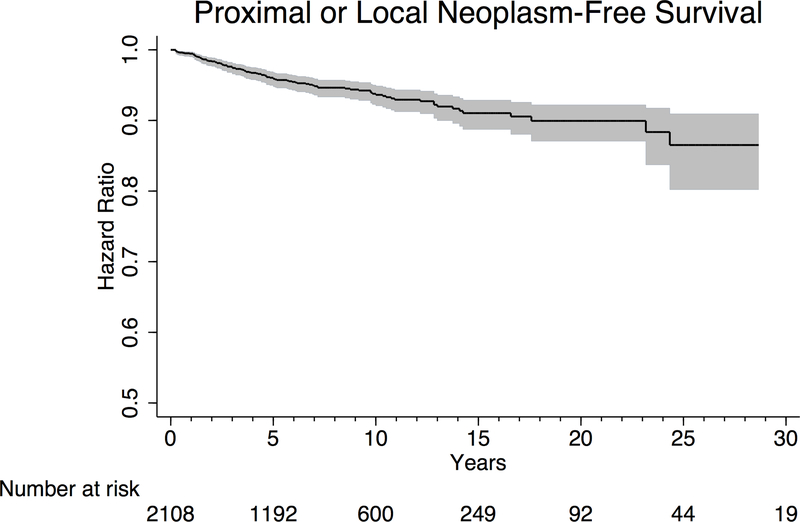
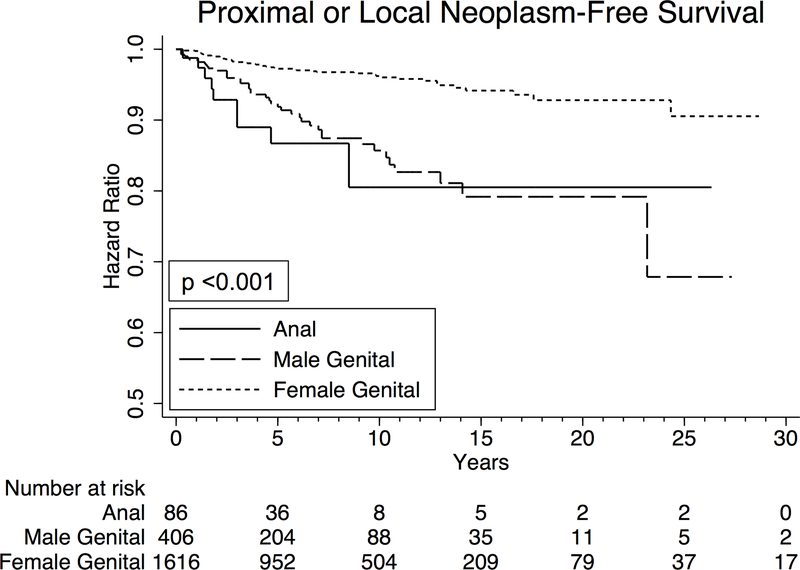
Figure 3.
Kaplan Meier curves depicting time to development of metachronous proximal or local neoplasms in (A) all patients with anogenital Paget’s disease, and (B) all patients with anogenital Paget’s disease, separated by primary site of disease. Grey shaded area represents 95% confidence interval.


