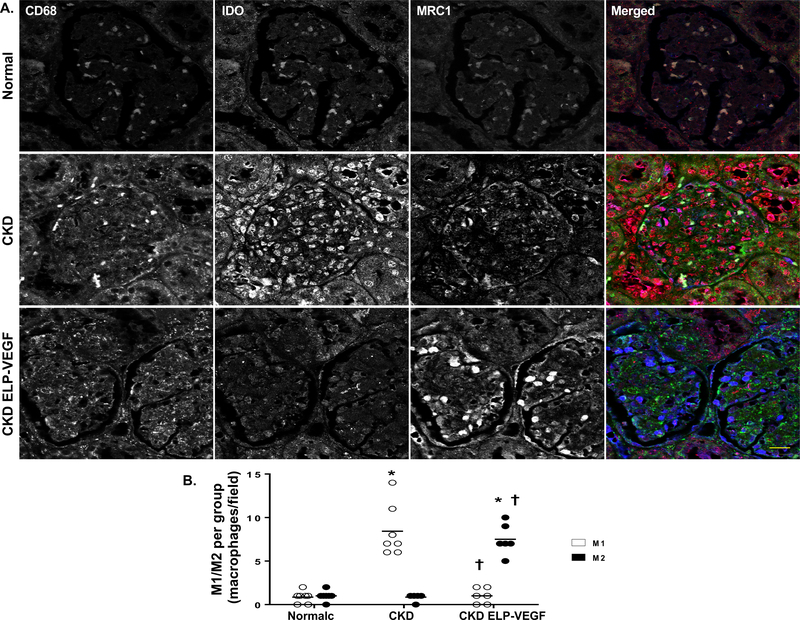
Figure 3.
Representative immunostaining for markers of total (CD68, green), M1 (IDO, red), and M2 (MRC1, blue) macrophages (A) and quantification of M1/M2 staining (B) from normal, CKD, and CKD ELP-VEGF pigs after 14 weeks of observation (n=6–7/group). Dense renal infiltration of macrophages was observed after 14 weeks of CKD, with a predominance of M1 macrophages over M2. Notably, although the number of renal macrophages remained elevated, there was a marked shift towards an M2 phenotype after ELP-VEGF therapy. Scale bar represents 20 μm. *p<0.05 vs. normal; † p<0.05 vs. CKD (Single way ANOVA, Tukey).

