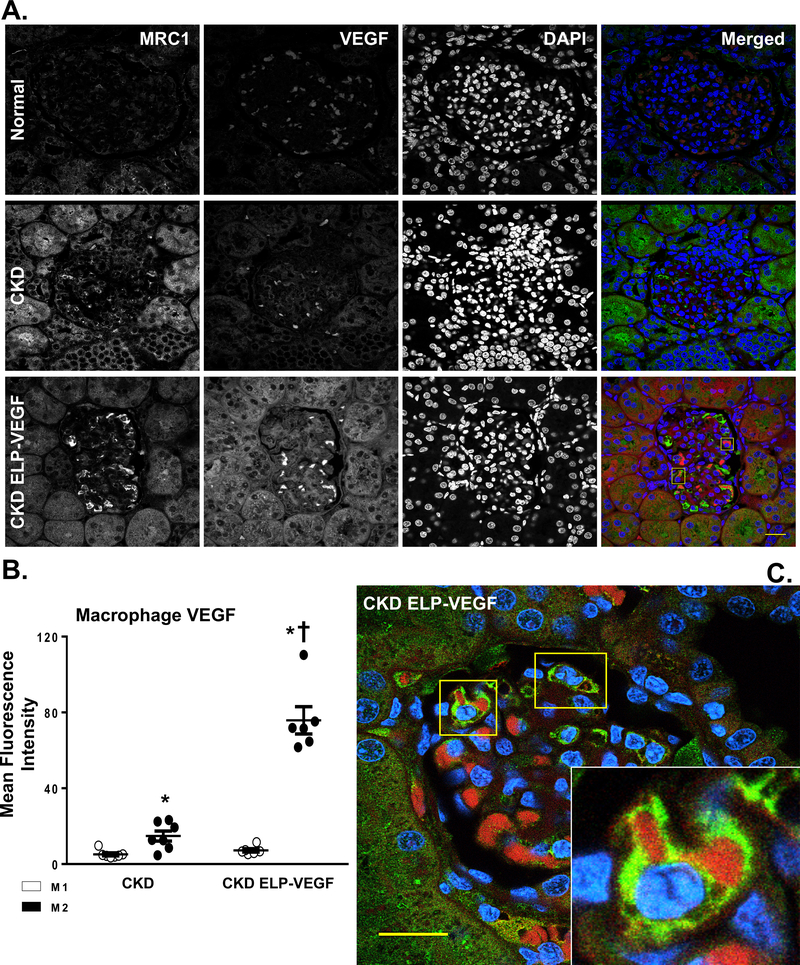
Figure 4.
A-B) Representative quantification (A) of renal cross sections showing co-immunoreactivity for M2 macrophages (MRC1, green), VEGFA (red), and DAPI (blue) from normal, CKD, and CKD ELP-VEGF pigs after 14 weeks of observation (n=6–7/group). B) Quantification of mean fluorescence intensity of VEGF staining in M1 and M2 macrophages. C) Representative magnified renal cross section showing glomerular cells displaying co-immunoreactivity of MRC1, VEGFA and DAPI (n=6–7/group) treated with ELP-VEGF therapy. Normal kidneys showed dispersed VEGF staining, which was attenuated in CKD. After ELP-VEGF therapy in CKD, significantly increased VEGF expression was observed predominantly inside of M2 macrophages. Although representative glomeruli are shown here, accumulation of VEGF-expressing M2 macrophages after ELP-VEGF therapy was also observed in the peritubular spaces. Scale bar: 20 μm. *p<0.05 vs. CKD M1 and CKD ELP VEGF M1; † p<0.05 vs. CKD M2 (Single way ANOVA, Tukey).

