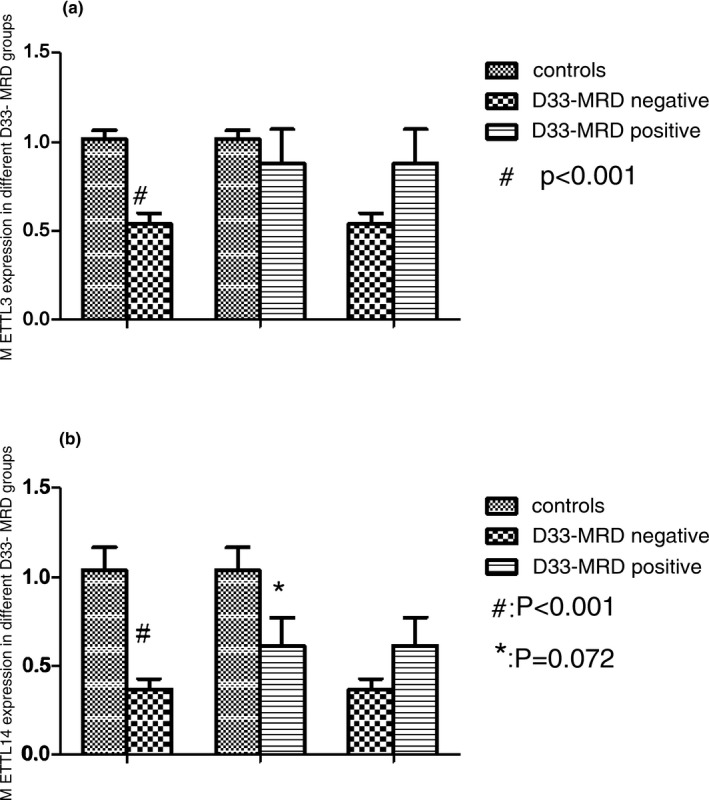
Figure 2.

METTL3 and METTL14 expressions in different risk groups. (a) The gene expression of METTL3 in SR, IR, and HR were lower than in controls. # p < .001, patients (SR) versus normal controls, *p = .002, patients (HR) versus normal controls. (b) The gene expression of METTL14 in SR, IR, and HR were lower than in controls. # p < .001, patients (SR) versus normal controls, *p = .05, patients (IR) versus normal controls. & p < .001, patients (HR) versus normal controls. Abbreviations: HR, high risk; IR, intermediate risk; SR, standard risk
